Watchdoc Tools - WDIS - Managing errors
Error when running the script
-
Symptom: Error message after running the script.
-
Analysis:
-
check the syntax of the command;
-
check the presence of the .NET Framework;
-
check the WDIS path.
-
Receiving
-
Symptom: The document does not appear in the desired directory or no email is received.
-
Analysis: check that you have correctly entered the file name in the "- file c:\WDreports\report1.csv" option or check in Watchdoc that the SMTP server is correctly entered and operational.
Feeback value error
-
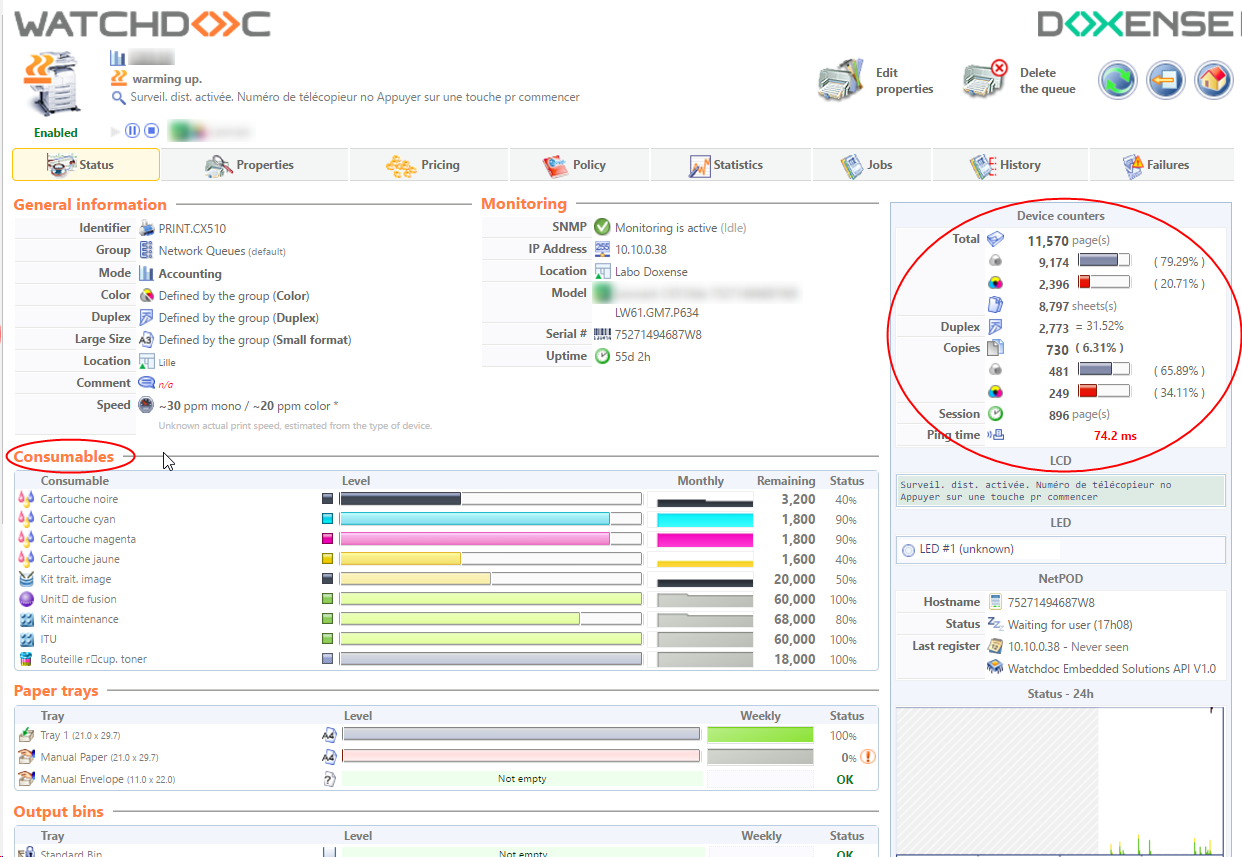
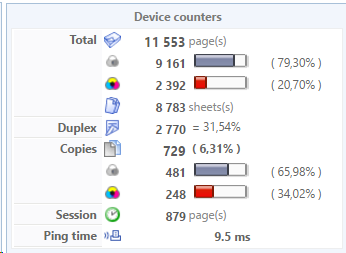
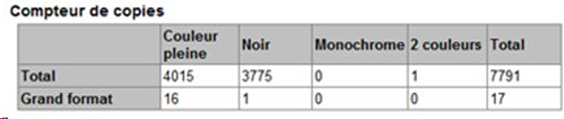
Symptome: when performing an extraction on data in SNMP (counter, consumables), you notice that some columns are incomplete (e.g. the colour copy counters).
-
Analysis: from the Watchdoc web interface, check that the information (consumable or counter) for the queue is present in the print queue (Status tab).
-
if the information on the consumables and counters is present:
-
check that the argument [OPTIONS] does not include a value that distorts the result (in particular dates corresponding to a period of tool activity);
-
in the Watchdoc web interface, check in the incident log that this peripheral was properly inspected and available during the period for which you want to obtain data;
-
in the log files, check that Watchdoc has compressed the SNMP data (scheduled task set to take place by default at midnight). The Watchdoc software compresses the SNMP data; check the correct execution of this step in the logs
-
-
If the information on the consumables does not appear:
-
check that the SNMP (v1) on the printing peripheral and on Watchdoc is activated
-
Contact Doxense help desk and provide the following information:
-
Printer name:
-
Manufacturer:
-
Model:
-
Empty or incorrect column: (write the name as it appears in the WDIS table):
-
-
-
Provide the following attachments:
SNMP dumps (.bin and .txt) with SNMPWalker on the IP address of the printing peripheral (available with the documentation on the Doxense website as well as in the Tools sub-directory of the Watchdoc installation folder).
A screenshot (.jpeg format) of the printing peripheral counters (go to the web interface of the periphery in the Counter section) with information on the missing counter or consumable (in our example, this is the colour copy counter.
The speed and validation of the troubleshooting operation will depend on our relationship with the manufacturer.
Viewing the data of a Dump in Watchdoc
In order to view the SNMP information feedback from a photocopier not known to the printing server in Watchdoc:
-
carry out an SNMP dump (in a .bin file) using the SNMPWalker tool (available with its documentation on Connect, the client extranet dedicated to partners, as well as in the Tools sub-directory of the Watchdocinstallation folder);
-
from the Windows Print Management console, create a print queue that redirects to a local "NUL" port;
-
adding this print queue in Watchdoc will allow the "NUL" port to be detected and will automatically deactivate SNMP monitoring;
-
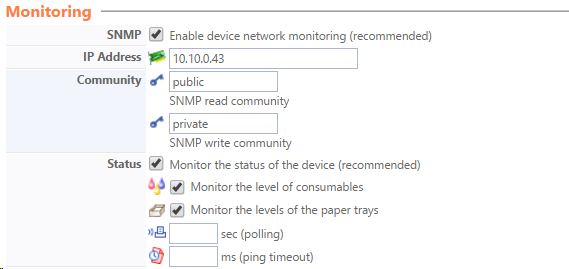
in the print queue properties, reactivate SNMP monitoring and in the IP address field, direct to the .bin dump file as shown below:
The SNMP information contained in the Status tab of the print queue thus becomes visible.