Overview
The Supervision Console provides detailed and refined views of the print queues controlled by Watchdoc, especially malfunctioning queues.
Access the administration interface
-
From the WSC Main Menu, click on Print queues button:
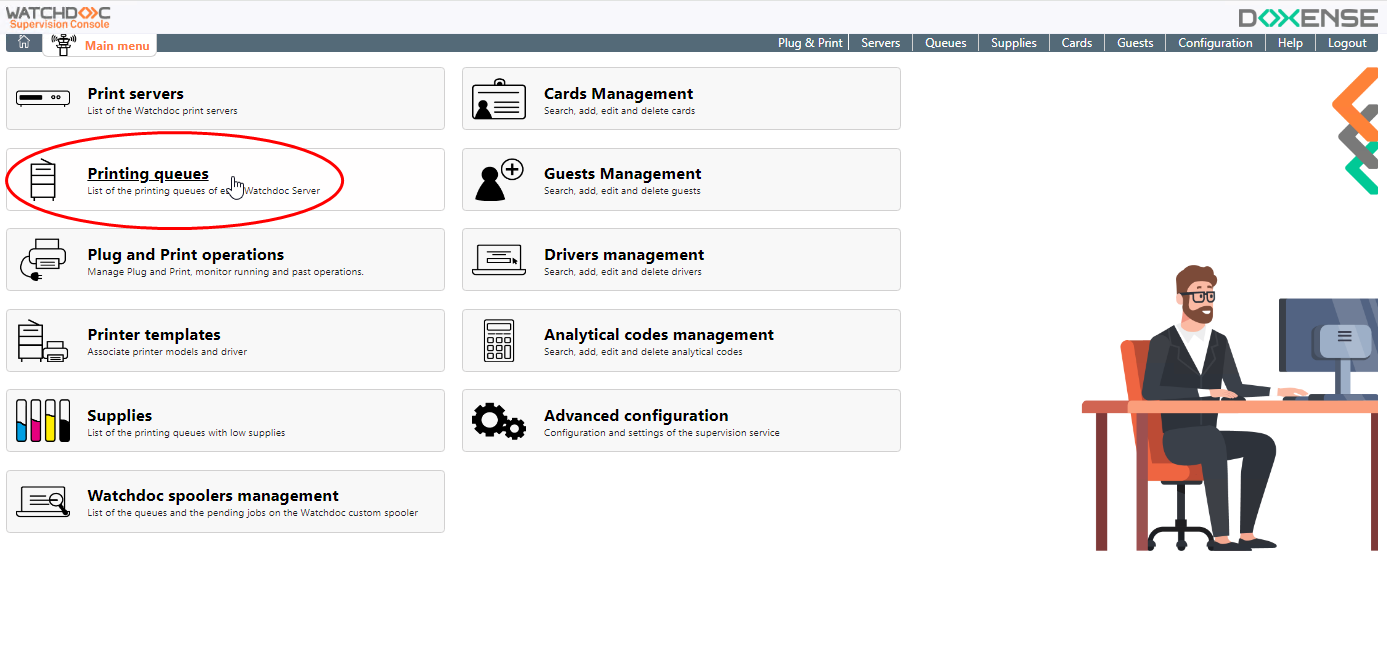
è you access the Printing queues in error interface in which are displayed print queues that malfunction: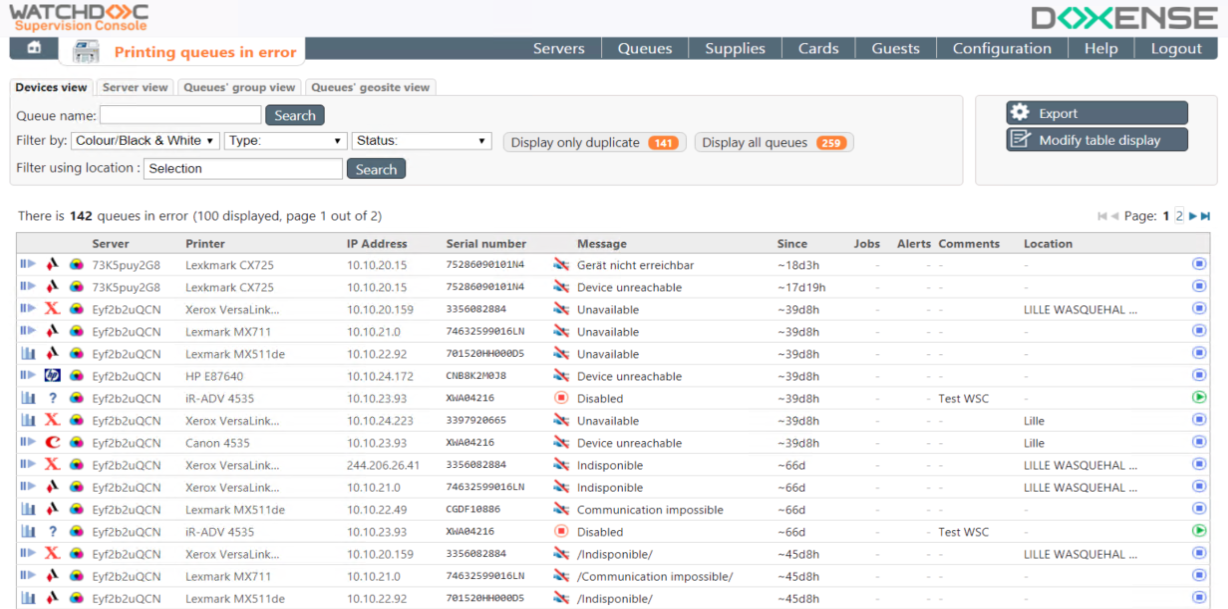
N.B. : to access the exhaustive queues list, click on the button  .
.
Consult the failures of a print queue
List description
In this list, some different data about queues are displayed in the following columns (each header, clickable, is a sort criteria).
Column Icons: icons give more information about the queue's brand and its configuration:
queue in validation mode;
queue in accounting mode;
trade mark logo;
black and white queue;
colour queue.
-
Server: displays the name of the server on which the queue depends;
-
Device: displays the device's name;
-
IP Addresse: device's IP address;
-
Serial number: displays the device's serial number;
-
Message: displays the error message relating to the queue, as sent by the device to Watchdoc:
-
Unable to communicate: DNS alias exists, but the device doesn't answer;
-
Unavalable: DNS alias doesn’t exist;
-
Paper jam… Lack of paper… Lack of ink…: one of the supplies prevents the device from working properly.
-
-
Since: indicates, in days and hours, the time elapsed since the beginning of the malfunction;
-
Jobs: indicates the number of print jobs affected by the device failure;
-
Alerts: number of automatic e-mail alerts sent;
-
Group: group to which the queue belongs;
-
Comments: information about the failing queue;
-
Location: physical location of the device;
-
Wes: identifier of the WES associated to the queue.
Tools allows to:
-
 deactivate: the queue doesn't work and all print-jobs are blocked;
 -
 reactivate: the queue is reactivated.
Search tools
You have some tools to refine the consultation:
-
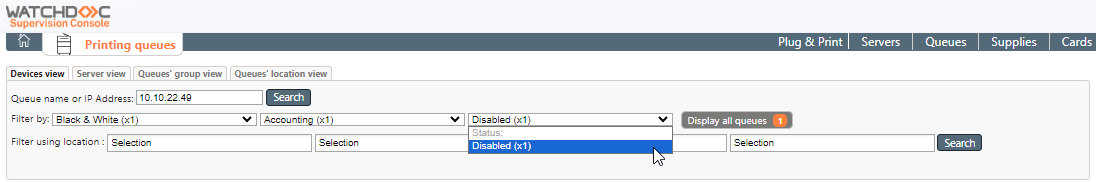
a search engine allowing requests with the queue's name (containing the entered string) or the queue's IP;
-
some filters allowing to select the queues according to their characteristics and/or status;
Consult the failures of a print queue
From the print queue list:
-
select the print queue you want to monitor the activity:
-
click the
 button to access the actions menu: all supervision's actions are displayed:
 -
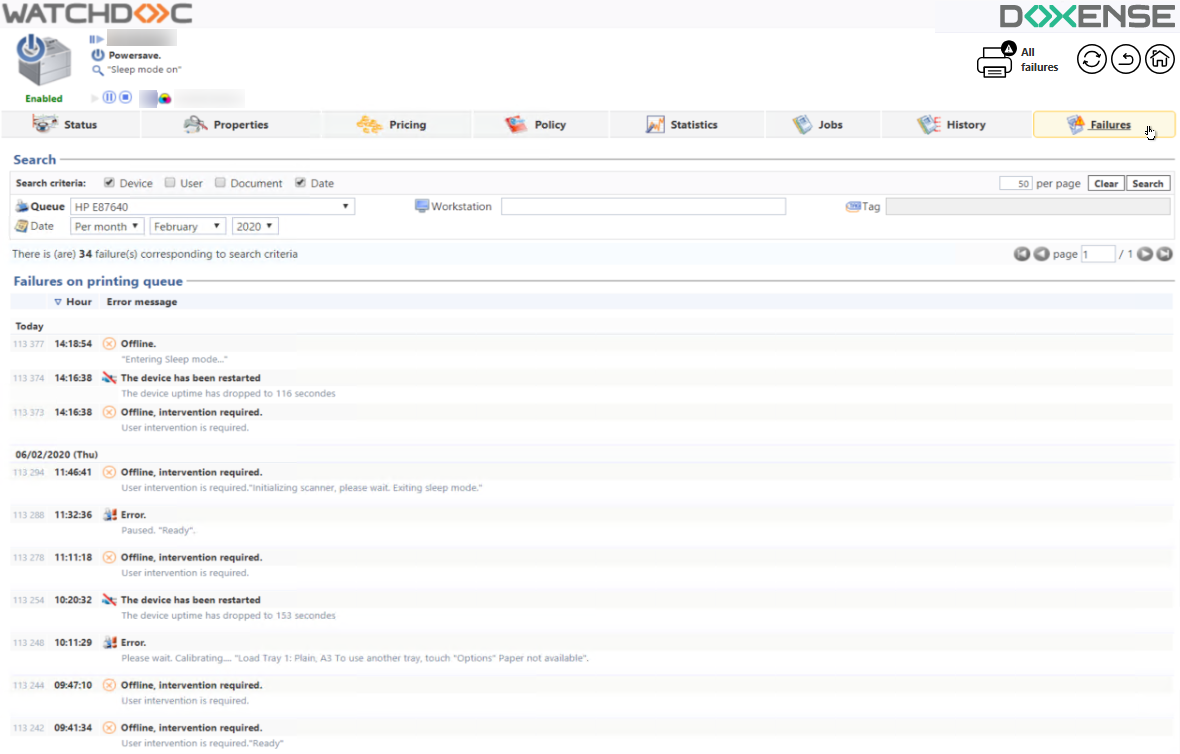
click on one of the action button:
button Recent failures send to the list of failures occured during the previous month;
button All failures send to the list of all failures, without dates restriction;
button Printing history send to the printing history of the queue;
button Statistics send to the statistics of the print jobs done on the queue;
èyou access the Watchdoc administration interface. Log on as an administrator to consult detailed information about the queue: