Elasticsearch Log Connector - Presentation
Principle
Elasticsearch Log Connector is a tool for aggregating all Watchdoc logs files into one Elasticsearch® database.
This tool is usefull when Watchdoc is installed in complex configurations, especially when the "interservers" feature is activated. In this case, since print jobs can be redirected from one server to another, it is difficult to diagnose the cause of a malfunction due to the dissemination of log files across the differents servers of the configuration. Gathering them togehter in a single database therefore makes it possible to optimize the search and, then, the diagnosis.
The sending of logs is defined by default: saved in a queue (system of "message queuing"), these logs are systematically sent to the database Elasticsearch as soon as the previous packet of logs has been received. These queues can therefore be more or less loaded depending on the activity.and malfunctions that have occurred.
Prerequisites
The implementation of the connector requires the following prerequisites:
-
Watchdoc v 5.4 installed on the master and other Watchdoc servers;
-
Elasticsearch (v.7.9.0) database;
-
Access port to the Elasticsearch server opened (9200 by default).
Procedure
Access the configuration file
Elasticsearch Log Connector is activated and configured from the Watchdoc.exe.config.xml.configuration file.
To activate the tool:
-
as an administrator, access the server that hosts Watchdoc ;
-
go to the folder C:\Program Files\Doxense\Watchdoc to find the Watchdoc.exe.config.xml configuration file;
-
save this Watchdoc.exe.config.xml configuration file before modifying it;
-
open the file with a text editor and modify it.
Configure Elasticsearch Log Connector
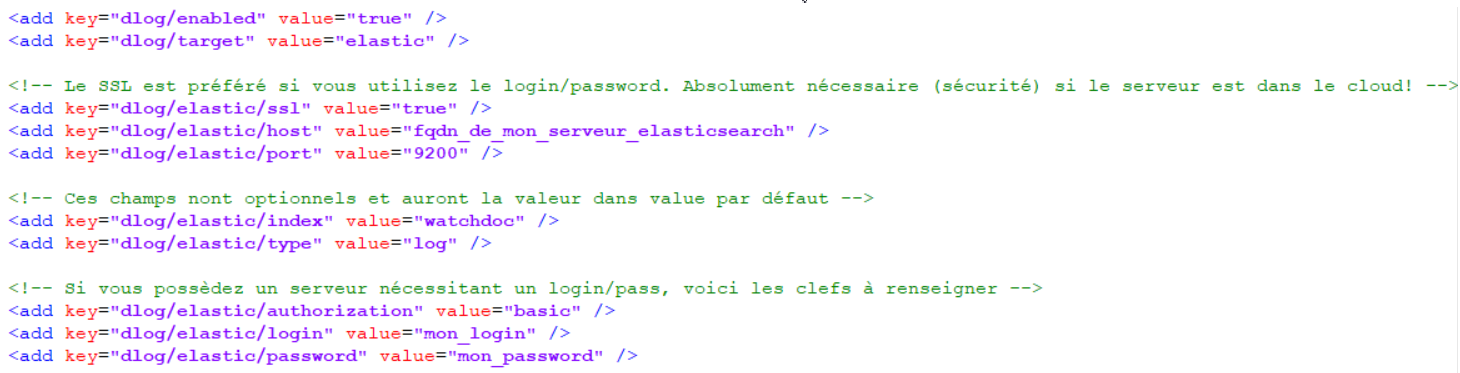
In the Watchdoc.exe.config.xml configuration file, add the following keys:
<add key="dlog/enabled" value="true"/>= the "true" value allows to activate the connector;
<add key="dlog/target" value="elastic"/>= the value allows to precise the database in which the logs are sent;
<add key="dlog/elastic/ssl" value="true"/> = the value "true" enables the secure sending of logs by ssl protocol;
<add key="dlog/elastic/host" value="fqdn_elasticsearch_server"/> = the value corresponds to the fully qualified domain name of the server that hosts Elasticsearch®;
<add key="dlog/elastic/port" value="9200"/>= the value corresponds to the database access port;
<add key="dlog/elastic/index" value="watchdoc"/>= the value allows to precise the log source in order to optimize the indexing ;
<add key="dlog/elastic/type" value="log"/>= the value corresponds to the document type saved in the database. This information allows to precise the file indexing.
<add key="dlog/elastic/authorization" value="basic"/> = the value "basic" indicates tha the access to the server is subject to authentication by login and password: in this case, it's necessary to complete the two following keys. The value "none" indicates that the access to the server is not subject to authentication and therefore the two following keys are not processed.
<add key="dlog/elastic/ssl" value="login"/> = the value "login" contains the login authorized to connect to the server hosting Elasticsearch®;
<add key="dlog/elastic/password" value="password"/> = the value "password" specifies the password of the account authorized to access the server hosting Elasticsearch® when the access is authenticated.
-
Save the configuration file.
-
Restart the Watchdoc service
-
In Elasticsearch®, launch a query on the logs files to check the efficiency or the aggregation operation.