Activate Watchdoc web site logs - Procedure
Access configuration interface
-
Access the Watchdoc administration interface as an administrator ;
-
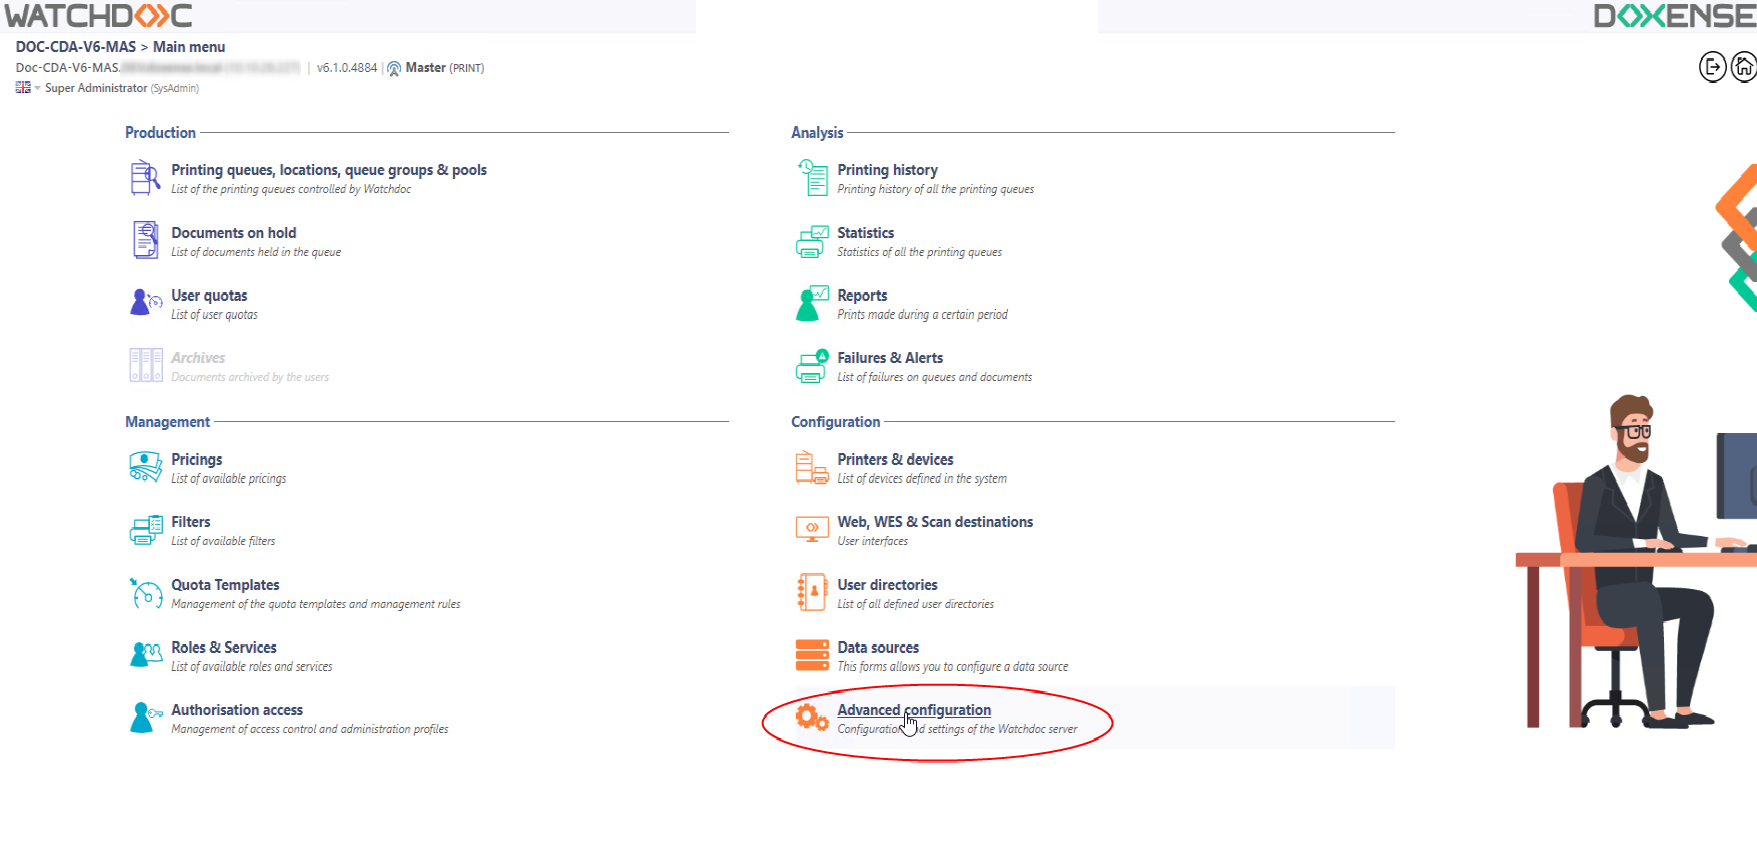
from the Main menu> section Configuration section, click on Adavanced configuration:
-
in Advanced configuration, click on System configuration (for a version prior to v. 6.1.1) or Web server :
èYou access System configuration or Web server interface. Some of this information was entered during the initial installation of Watchdoc.
Activate the DSP logs
In the System configuration or Web server interface:
-
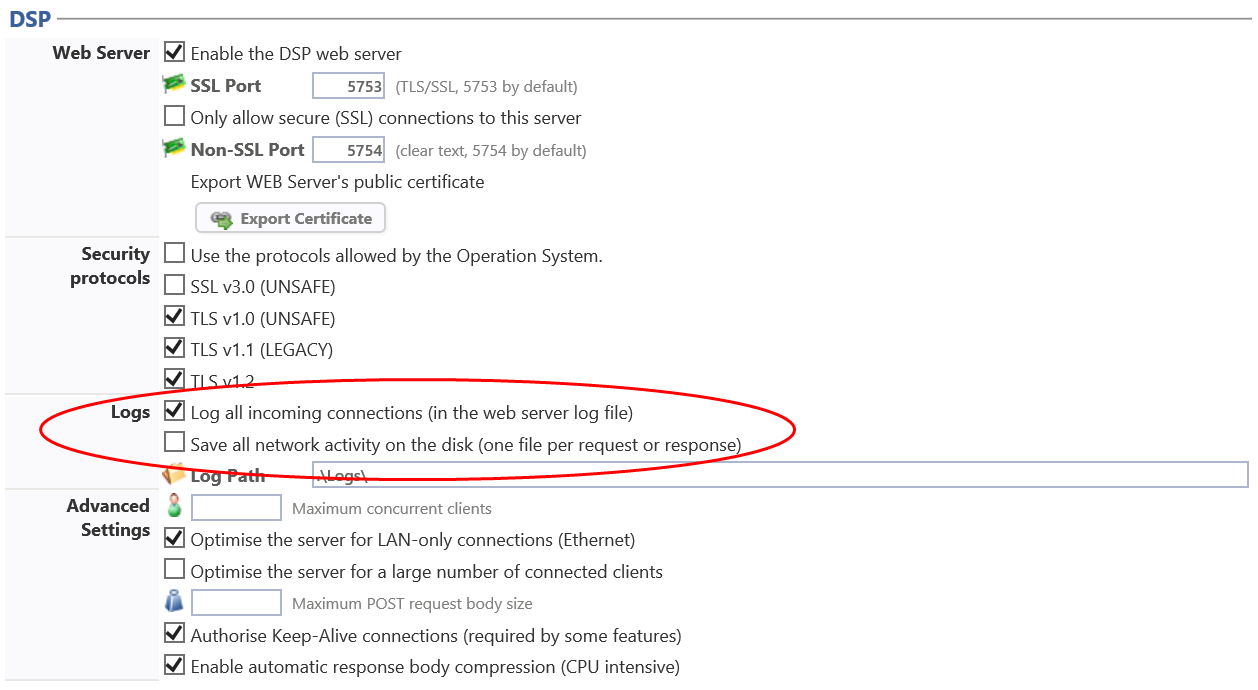
in the DSP section, logs sub-section Logs, set the parameters:
-
Log all incoming connections... : check the box to save all requests from the devices to the Watchdoc web server;
-
Save all network activity on the disk : check the box to save all the exchanges between the printing devices and the Watchdoc service;
-
Log Path: indicate the folder in which the logs files are saved by default (C:\Program Files\Doxense\Watchdoc\logs). If necesseray, you can indicate an other folder
-
-
Click on
 to validate the System Configuration settings.
Increase the Watchdoc logs level
If the level of logs needed to analyze the malfunction is not sufficient, you can change it in 2 different ways:
-
Either with an online command ;
-
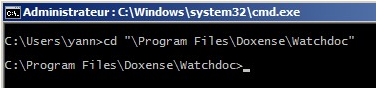
Open a command line;
-
go to the Watchdoc installation repository:
-
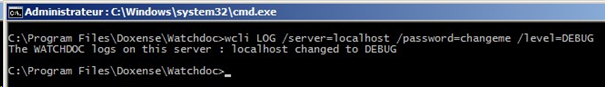
launch the following command: wcli LOG /server=localhost /password=changeme /level=DEBUG.
In this command:
-
the server parameter is the server on which the Watchdoc.exe service is running;
-
the password is the maintenance password of the Watchdoc target server;
-
the levelis the trace level that you want to apply (DEBUG or INFO).
èThe level of the trace applied after the command is effective until the next restart of the Watchdoc service or until the execution of the same command parsed with the level INFO.
-
-
Either using the configuration file:
-
Open the Watchdoc.exe.config file (saved by default in the C:\ProgramFiles\Doxense\Watchdoc folder) using a simple text editor (MS Windows Notepad® type)
-
replace the following line:
<add key="traceLevel" value="2" />
by:<add key="traceLevel" value="0" /> -
save the file, then restart the Watchdoc service ;
-
Activate the WES traces
When devices are equipped with WES, it may be necessary to enable logging of communications between the device and the Watchdoc server to diagnose an anomaly.
In this case, the activation of the logs must be done at the WES level. From then on, all the queues equipped with this WES are traced.
If the traces only concern one or more specific queues, in addition to activating the WES, the traces must be activated on the queue or queues concerned.
To activate the WES logs on a queue:
-
from the Main menu, Production section> Printing queues...;
-
click on the concerned queue, then on Edit properties;
-
In the printing queue Properties interface, go to the WES section;
-
For Diagnosis setting, check WES specific logs and specify Include binary content:
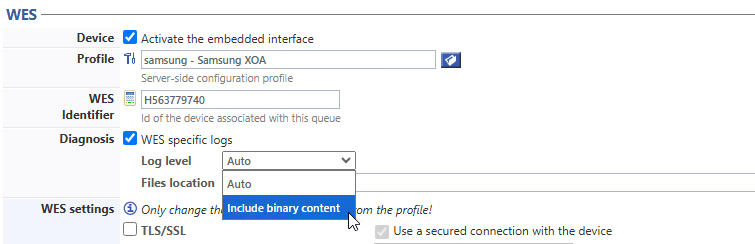
è By default, logs are saved on the Watchdoc \logs folder.
To activate this logs files:
-
from the Main menu > Configuration section, click on Web & Wes;
-
select the WES concerned,
-
in Miscellaneous section > Log options subsection, select:
-
Destination: All
-
and Level (we recommend you to choose the Info level);
-
-
validate the WES profile
-
go back to the Main Menu > Production section
-
in the WES section, click on the Reinitialize button.
From the Watchdoc Main Menu > Production section, click Printing queues, locations, queue groups & pools:
-
in the list; select the relevant queue;
-
In the queue management interface, click on the Properties tab;
-
in the WES section, click on the Reinit. button .
Since version 6.1.0.5052, it is also possible to activate WES traces (logs) from the WES print queue:
-
from the Main Menu > Production section , click on Printing Queues ;
-
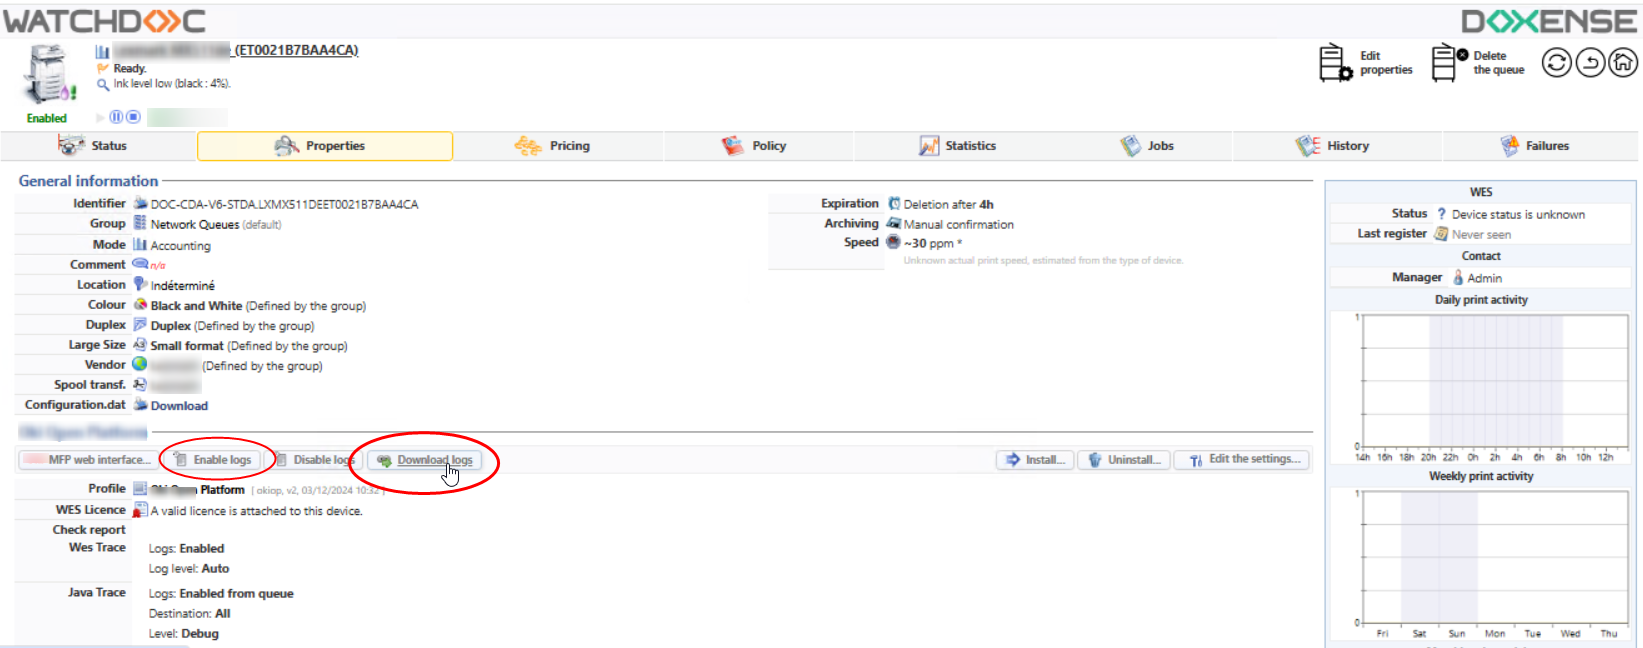
select the queue, then click on the Properties tab;
-
in the WES section,
-
click on Enable the logs
The WES Trace setting value informs on the logs status:
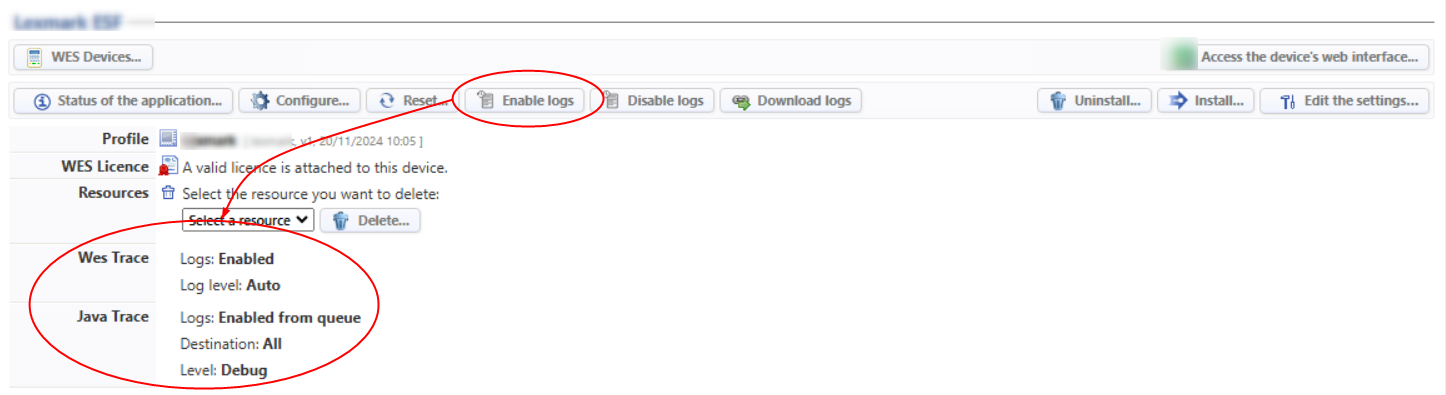
You can check in the WES profile that the Diagnostics and Log options parameters have been ticked: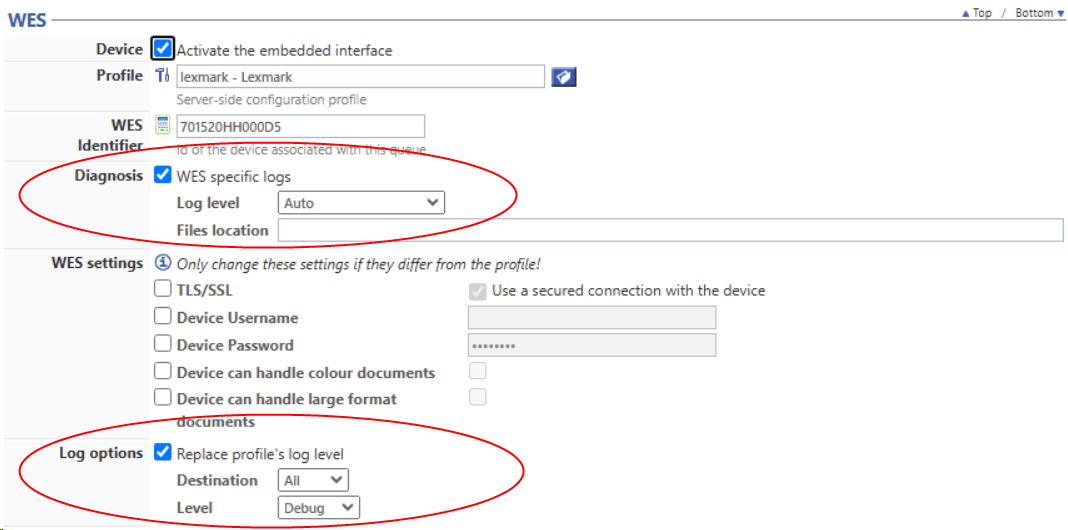
-
-
click on the Download logs button to analyse them.
-
if you no longer need to trace the WES, click on the Disable logs button.
Collect the advanced logs
To analyse dysfunction thanks to logs,
-
from the Watchdoc Main menu > Production section, select the concerned queue;
-
click on the Properties tab;
-
in the WES section> Other options subsection, click on the Enable logs button;
-
in Watchdoc, replicate the anomaly;
- in the WES section> Other options subsection, click on the Download logs button ;
èWatchdoc creates a compressed logs archive which you can save in your work space.