Watchdoc Tools - WinDGB - Analyse Dump with WinDGB - Procedure
Load the dump and rename mwcorwks.dll
To load the dump :
-
run WinDbg 64 bits (for a dump reatlised on a 64 bits platform);
-
open the dump file with CTRL-D (and not with a drag&drop) ;
-
specify the file name waited by WinDbg by running the following command:
.cordll -ve -u -l

In this example, the mscordacwks.dll dll must be renamed mscordacwks_AMD64_AMD64_4.6.1055.00.dll
-
rename the DLL file mscordacwks.dll with the name identified in the previous step.
Load SOS and CLR
Load the SOS and CLR modules thanks to the following commands:
-
!load sos
-
!load clr
if the operation is successful, no message is displayed
Usefull commands
-
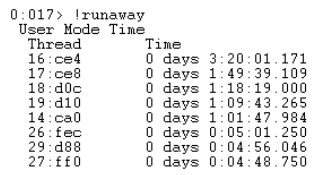
Find the process consuming CPU thanks to the !runaway command that enables to specify the process consuming CPU.
-
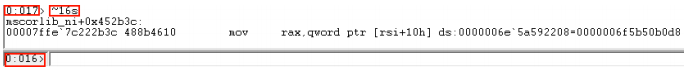
Select a thread thanks to toe ~<ID du Thread>s that allows you to place yourself in the context of the desired thread:
-
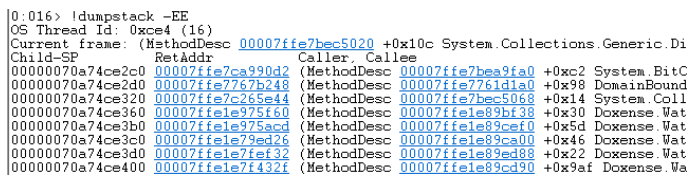
Display a dump of the stack thanks to the !dumpstack -EEcommand that allows to display the call stack that is managed with the Descriptors method:
-
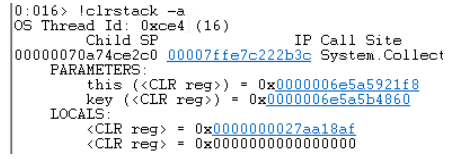
Display the CLR stack thanks to the !clrstack command that may be coupled with:
-p to display the parameters;
-l to display the locals;
-a to display the two.
-
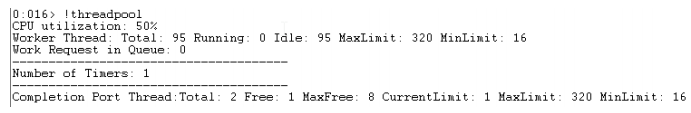
Display the threadpool information thanks to the !threadpool command displays information, especially the workers numbers, the CPU load, etc.
-
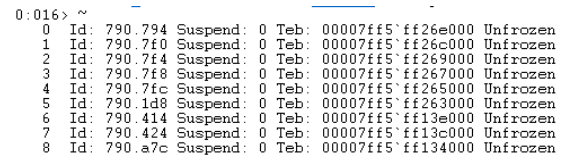
List the threads and their status thanks to the ~ command allows to display the threads and their status:
-
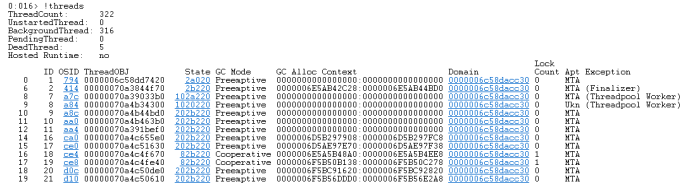
Display the threads thanks to tThe !threadscommand allows to display the threads and other informations like the lock count: