Procedure
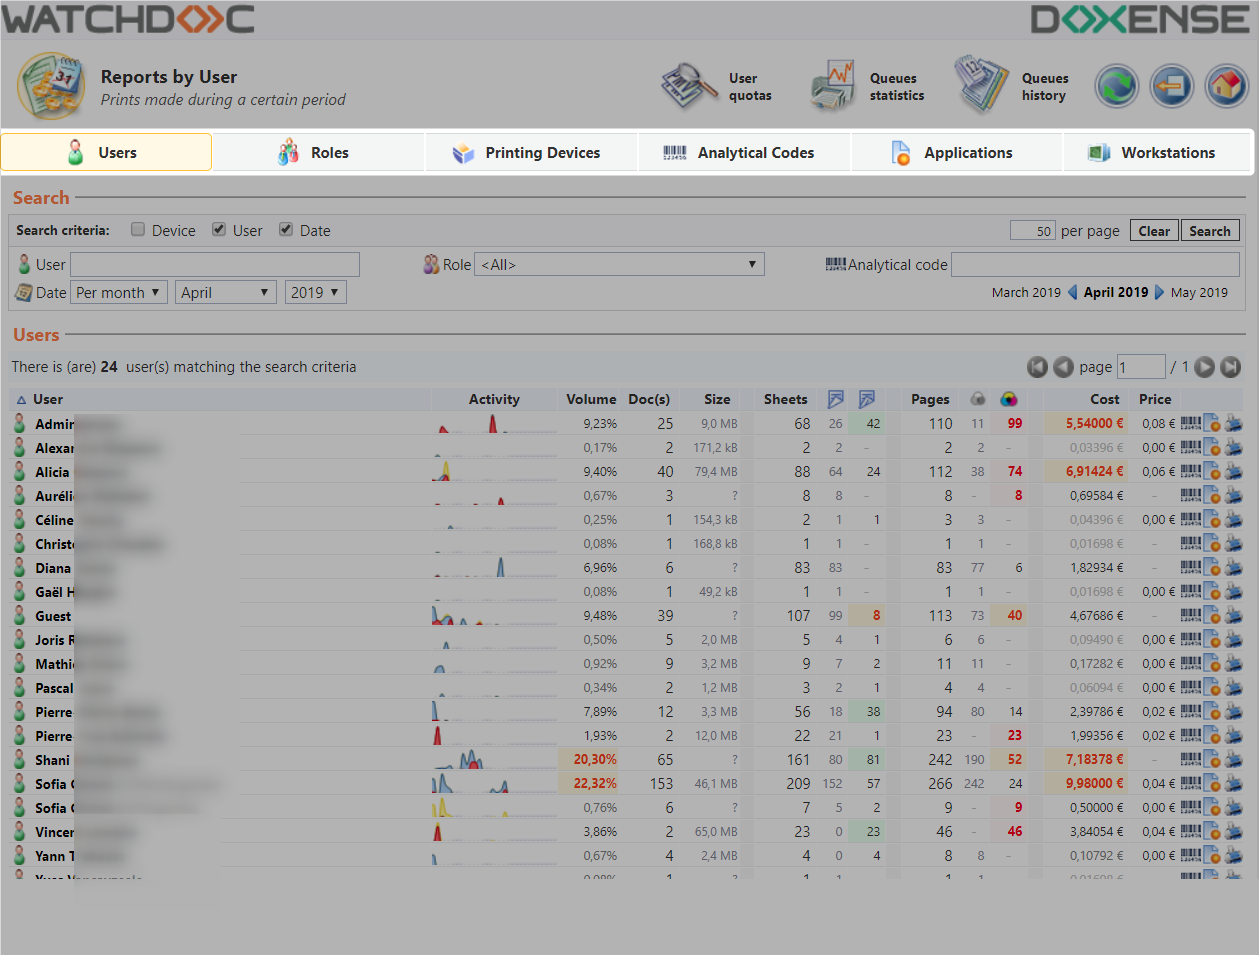
Presentation of the report viewing interface
Accessing the viewing interface
-
From the Main menu in the administration interface,
-
in the Analysis section, click on Reports:
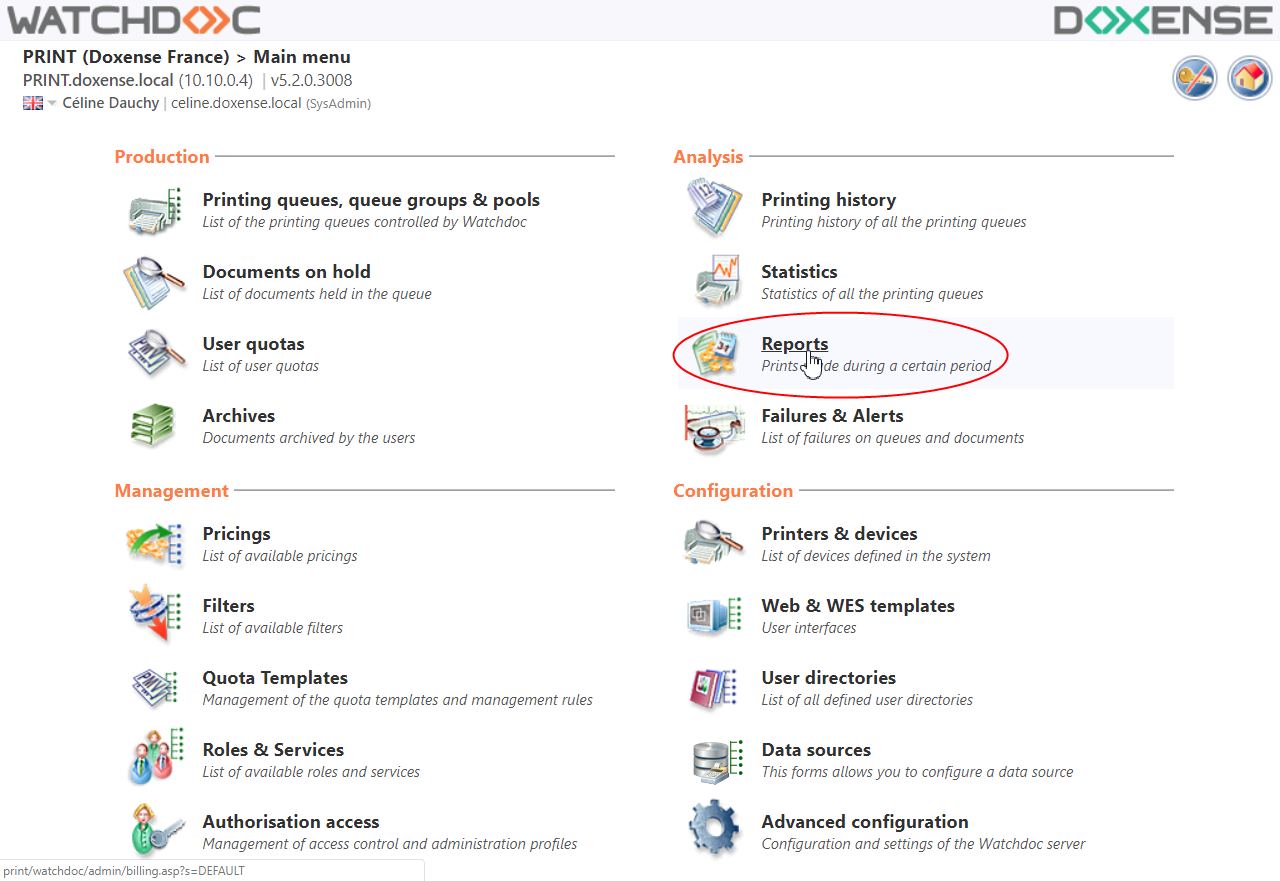
→ You will access the Reports interface where the reports are arranged under the various tabs:
by users;
by roles;
by printing devices;
by analytical codes;
by applications;
by workstations.
Each table has:
-
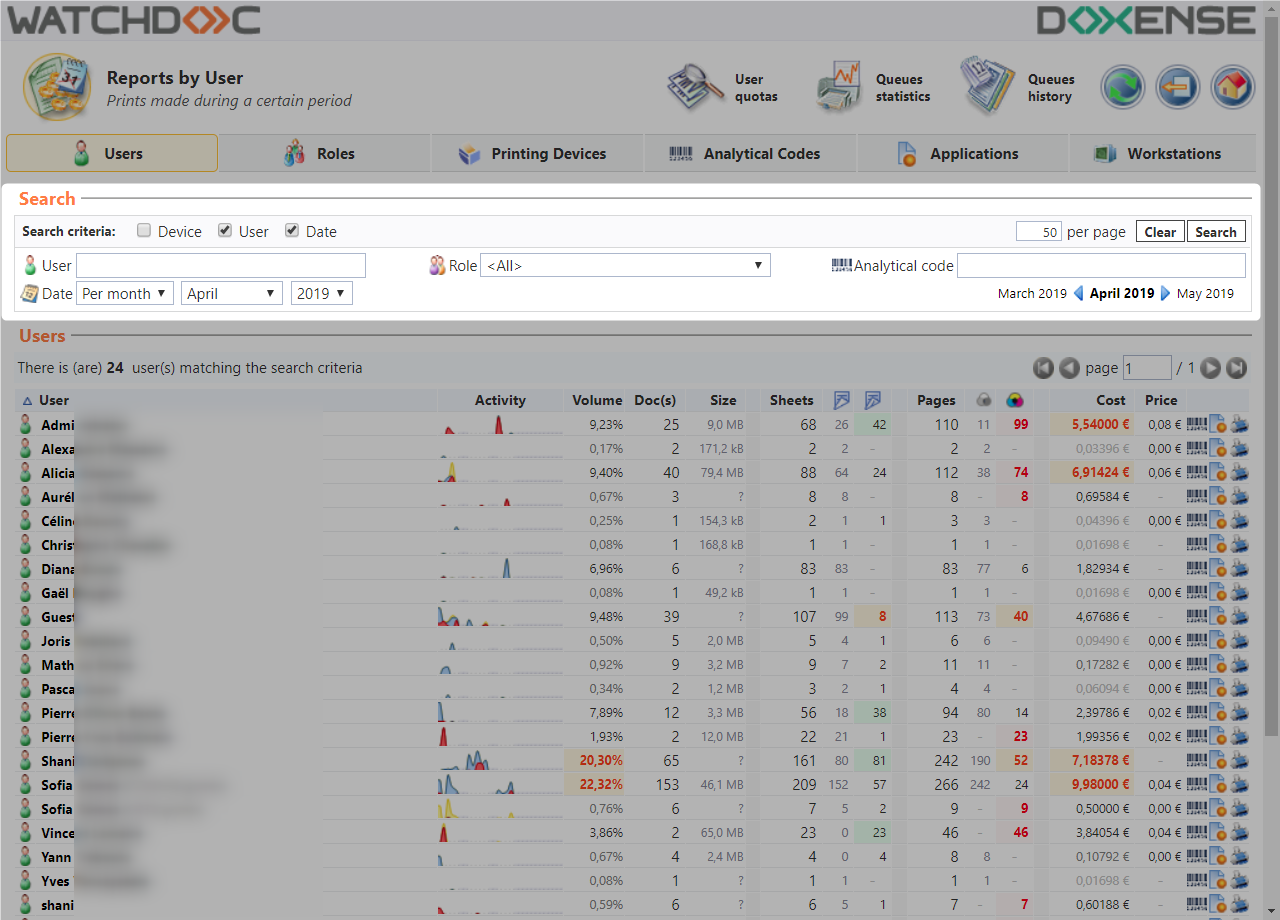
a Search section where a search engine can be used to reduice the report scope using precise criteria:
-
A specific section where the search results are displayed:
The upper banner comprises of three buttons so that you can directly access other related administration interfaces:


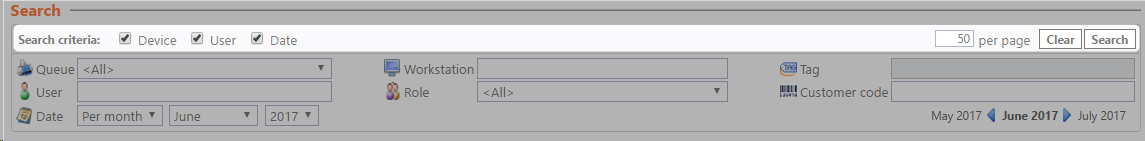
Search section tools
This section comprises various criteria for restricting the scope of the search:
-
Search criteria :check the boxes matching the criteria to enable for the search:
-
Device: for generating a report on a queue, a device or a tag;
-
User: for generating a report on a user, a role or a customer code;
-
Date : for defining the period covered by the report.
-
-
Per page: for specifying the number of results to display per page;
-
the Clear button allows you to clear all of the criteria to enter new ones;
-
the Search button allows you to start a seach based on the criteria.
Informations on the results list
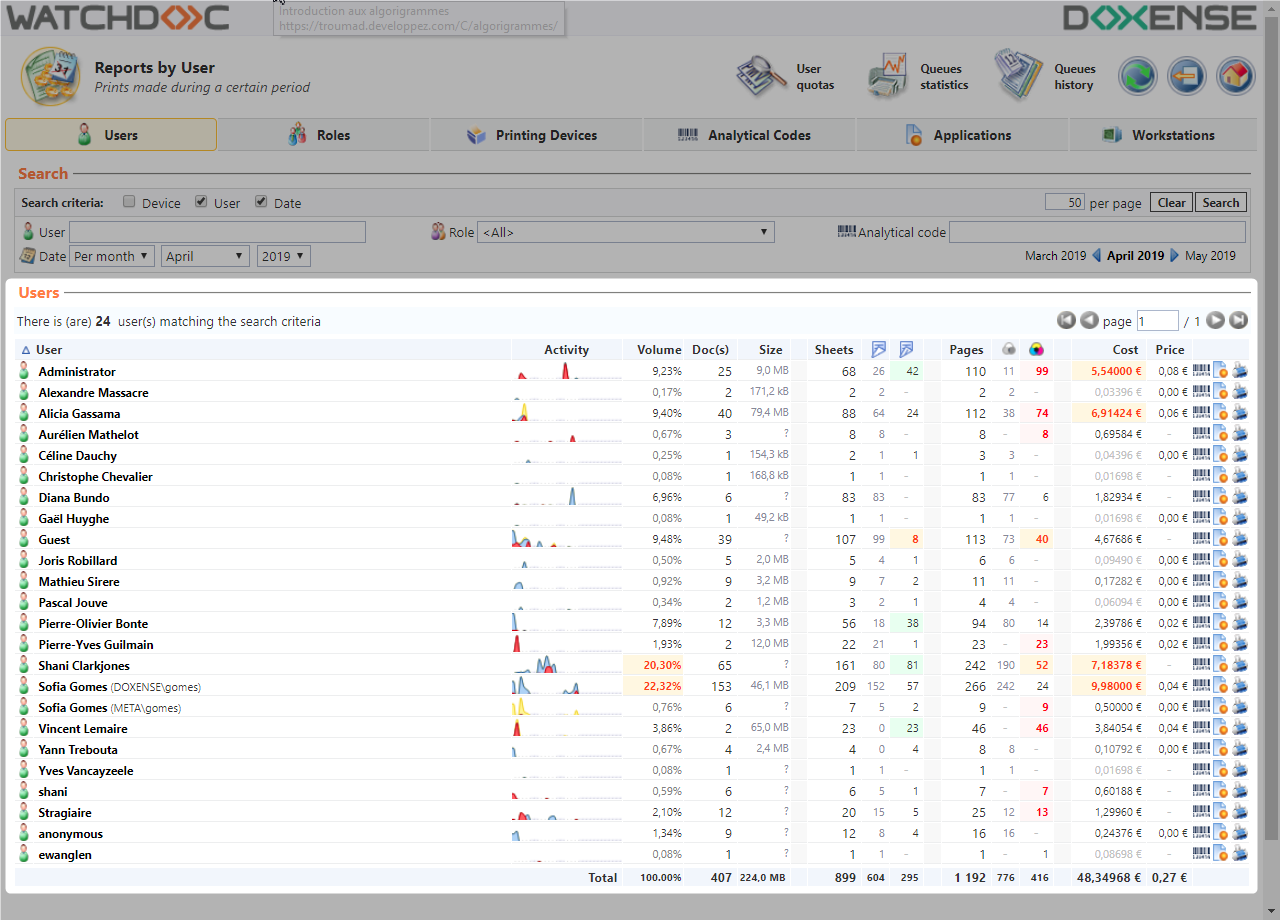
The results displayed in the list show the following information provided in several columns:
-
The ID of the entity searched for (user, role, device, analyitical code, application or device) along with a dedicated logo
-
Volume: Displays the percentage of the calculated total take by each component;
-
Docs: Displays the number of documents printed;
-
Size: Displays the average size per document.
-
Sheets: Displays the number of sheets used for printing all of the documents, broken down by one-side and two-side print outs (a two-side printed sheet generates two printed pages).
-
Pages : Displays the number of printed pages, split into black and white and colour print outs.
-
Cost: Displays the total print cost, i.e. the cost of paper plus the cost of printing. ;
-
Price: Displays the cost of paper.
The icons at the end of the line let the user directly access the other reports:
-
 : Report by user tab;
 -
 : Report by role tab;
 -
 : Analytical code tab;
 -
 : Report by application tab;
 -
 : Report by device tab.