Watchdoc - Statistics - Consult and export the Statistics data
Access the statistics management interface
-
From the administration interface Main Menu, in the Analysis section, click on Statistics:
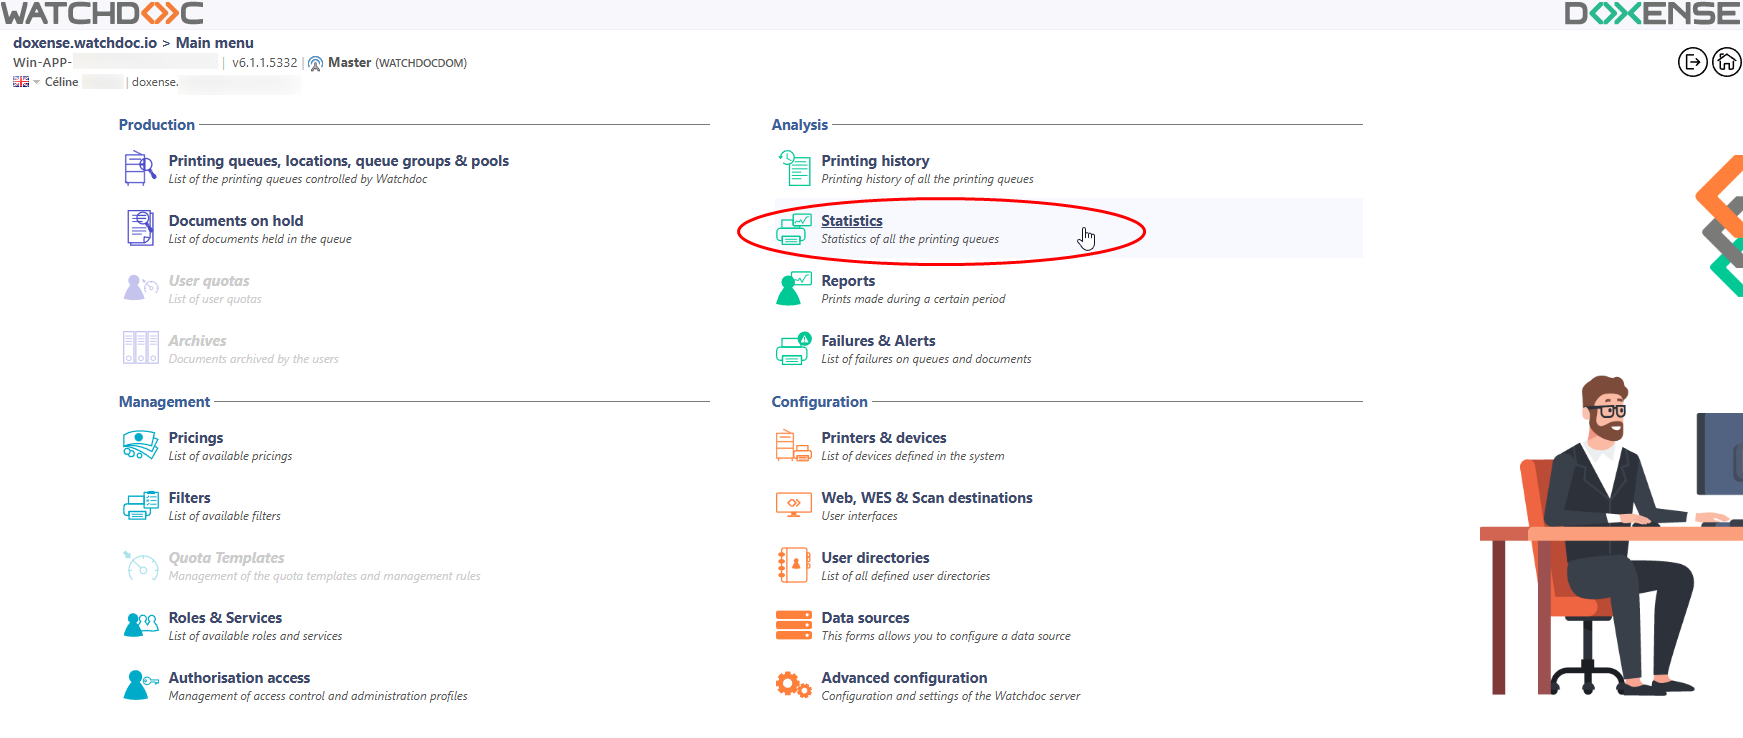
èyou will access the Statistics interface in which there is a search section and another section for displaying the data.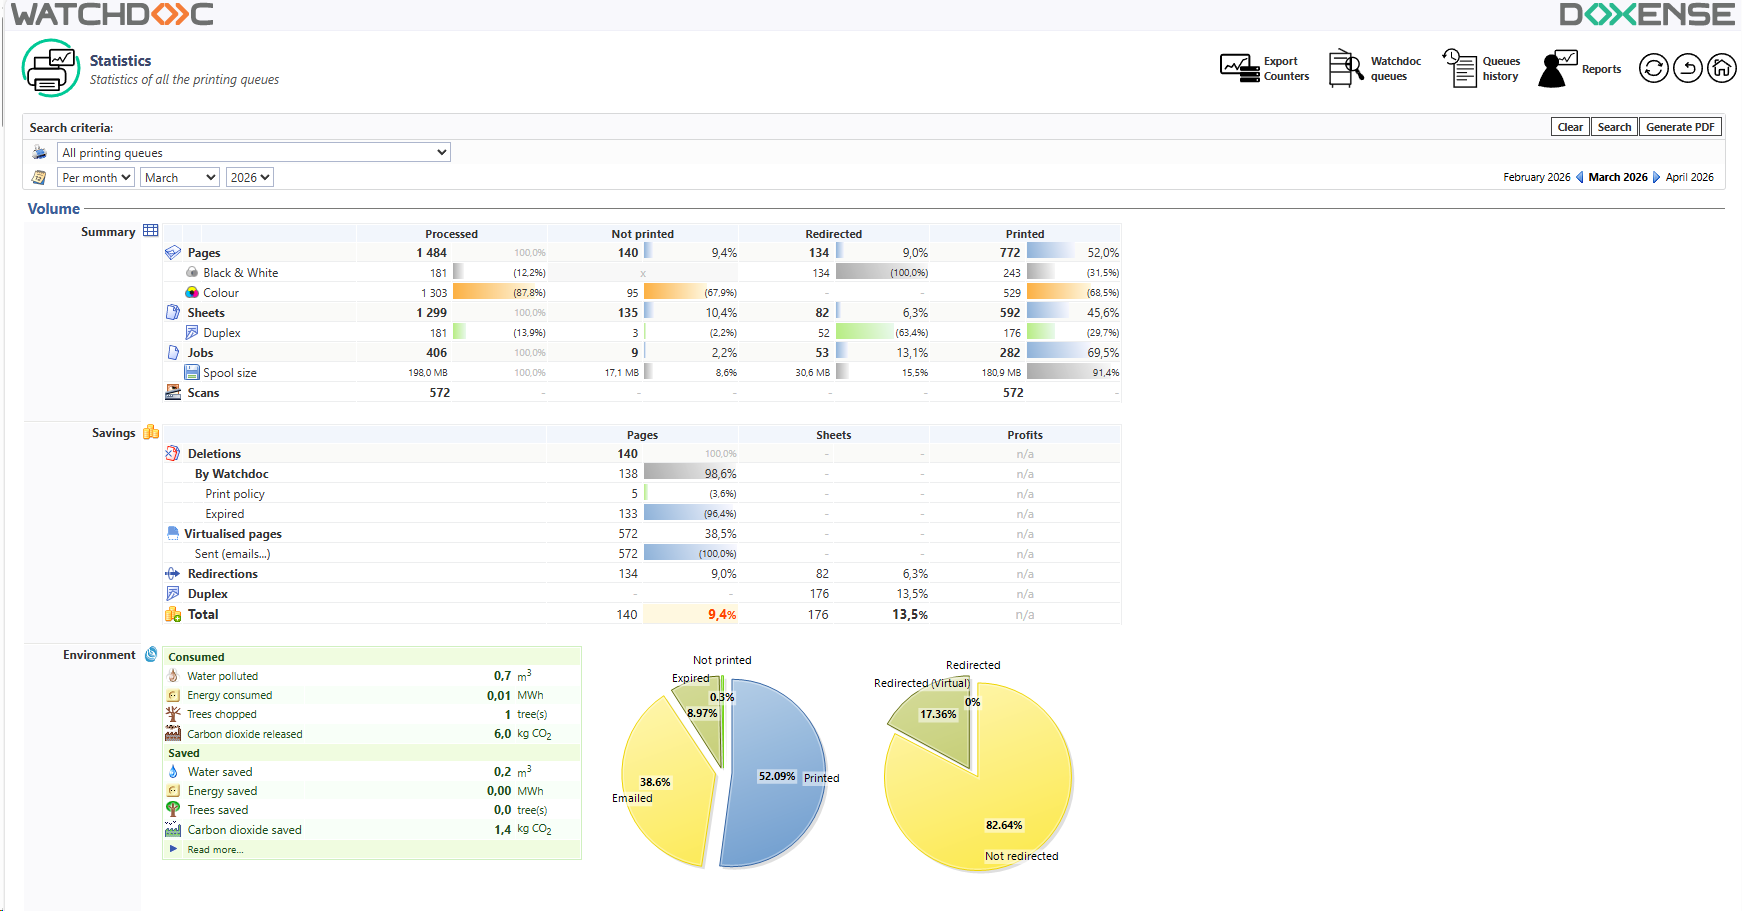
Search criteria section description
The Search criteria section contains an area to precisely define the scope of the statistics displayed:
-
the queue or the queue group;
-
the date or the date interval for which you want the statistics.
To launch the statistics search:
-
select the queue or the queue group whose statistics you want to display;
-
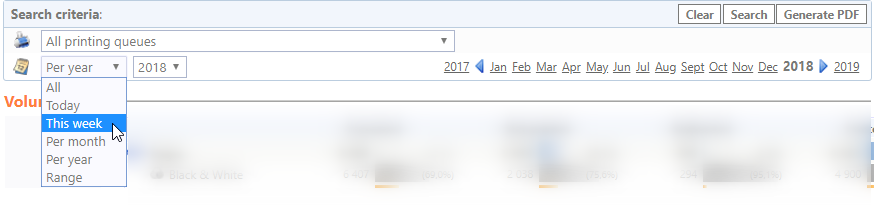
select the date or the date interval whose statistics you want to display :
-
either using the drop-down lists;
-
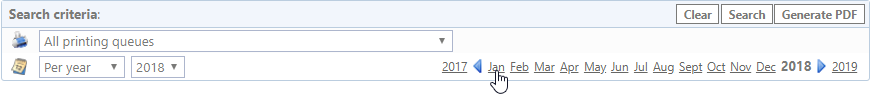
either using arrows to choose the days, the month and the year;
-
click on the Search button to launch the search:
Volume section description
Summary sub-section
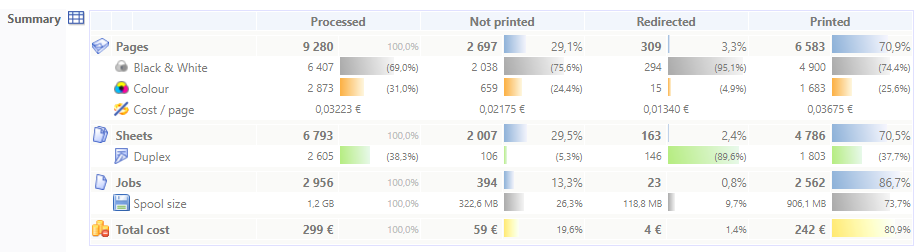
This section provides data about the printed documents in a cross tabulation.The documents are presented displayed according to their status:
-
Processed: displays the total of the print-jobs processed by the Watchdoc solution for a selected queue and a date interval predefined;
-
Not printed: number (and percentage) of the not-printed documents due to deletions requested by users, or at the end of an automatically predefined or by an application of rules constituting a printing policy;
-
Redirected: number of documents whose printing has been redirected to another queue (due to the unavailability of the queue on which they were launched, in particular);
-
Printed: number (and percentage) of documents effectively printed.
Savings sub-section
-
This section provides the savings made thanks to the operations carried out from the printing manager on:
-
(simplethe pages,x or duplex);
-
the sheets (simplex or duplex);
-
the documents : a set of several sheets.
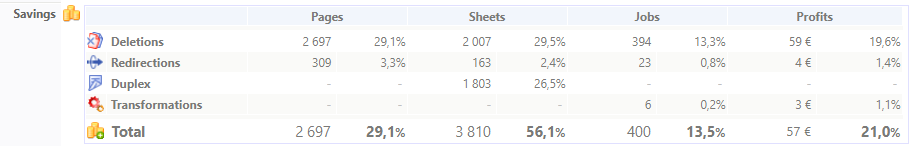
Operations that save money are:
-
deletions: deletion by the user or automatic deletion by the printing management system of the print-job;
-
redirections: redirections by Watchdoc, to send the printjobs to an optimized device based on the type of job to be printed;
-
recto-verso: printing mode using the 2 faces of a paper sheet.
Savings are shown in a currency predefined in the Watchdoc configuration and are calculated from the Real cost per page defined when configuring the queue or the queue group configuration (tab Tariff).
Transformations sub-section
The section displays the transformations applied on the print-job when the Spool transformations is activated.
The table gives details of the nature of the transformation that took place at the time of validation:
-
colour to black and white: number of colour print requests converted into black and white prints;
-
simplex/duplex mode: number of simplex (= single-sided) print requests converted into duplex (= double-sided) prints, or vice versa;
-
cut: number of pages deemed unnecessary that were deleted at the time of validation and therefore not printed;
-
number of copies: number of copy requests modified at the time of validation. (N.B.: a negative figure indicates that the number of copies requested was increased at the time of validation).
The table provides details on the methods of choosing the terms:
-
Processed: the transformation has been decide by the user;
-
Impromptu: accepted by the user after being suggested by Watchdoc;
-
Accepted: accepted by the user after being suggested by Watchdoc;
-
Declined: refused by the user after being proposed by Watchdoc ;
-
forced: configured in Watchdoc, the transformation is est imposed to the user.

Environment sub-section
This section displays the ecological impact of the print-jobs as well as the results achieved by the company for the environment through the use of Watchdoc. The reference for enabling the calculations are described in the Read more... section.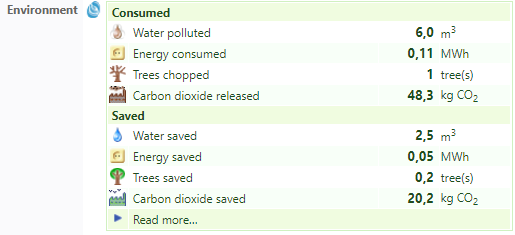
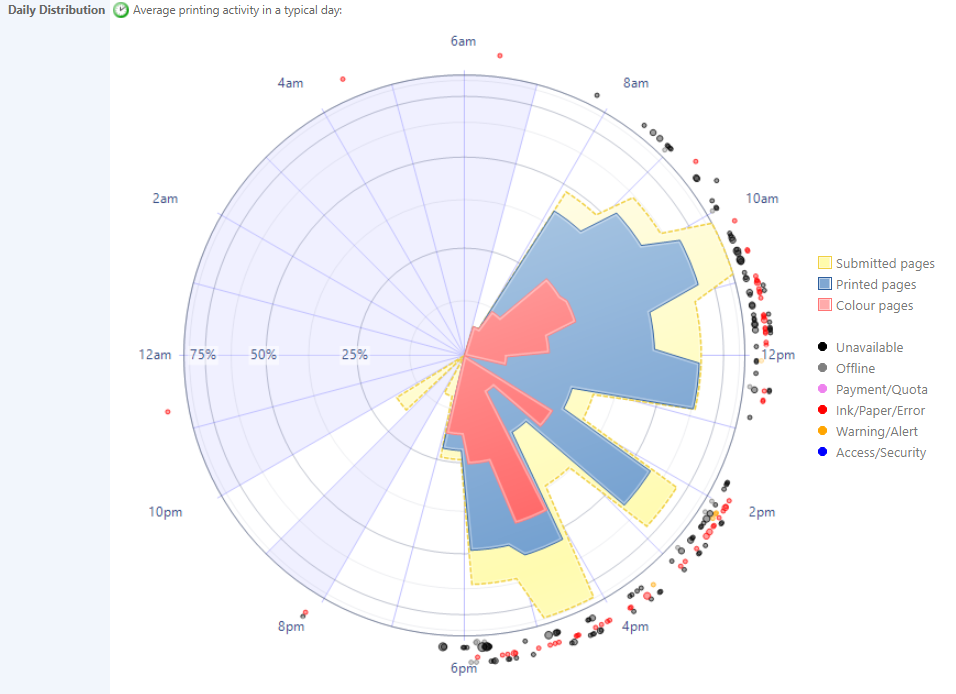
Activity section
The section contains a graph illustrating the printing activity, represented by 3 colours: 
-
by week, by month, by year, by day;
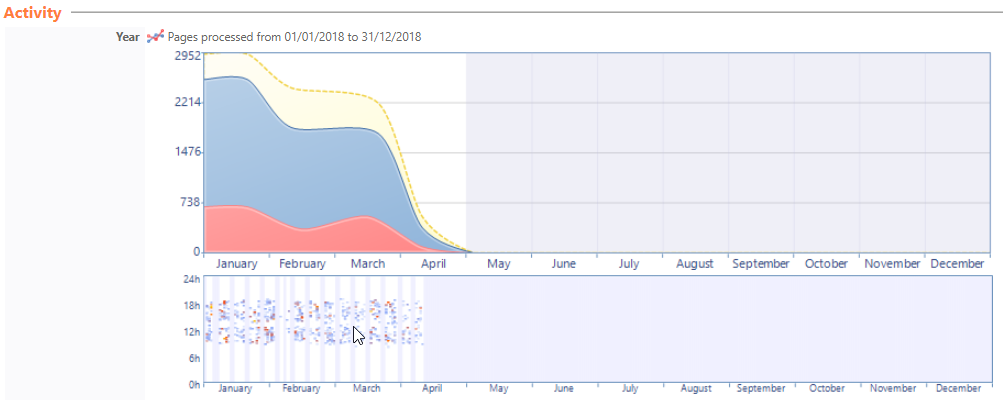
-
with a graph showing the distribution of requests by working hours, the results of printjobs and work and the device status:
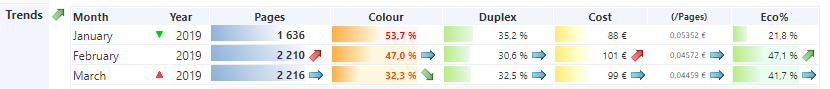
-
Trends: when statistics of a predefined period are requested, a Trends subsection is displayed to show the changes in the consumption during the requested period:
Classifications section
The section displays the queues groups, the queues, the devices fleet and the users in order, according their printing activity.
You then have a summary view of the activity of the users for whom are specified:
-
Pages: number of pages printed in the period;
-
Colour: the colour printed percentage rate in comparison with the total printed documents;
-
Sheets: the number of printed sheets in the period;
-
Duplex: the duplex printed document rate in comparison with the total printed jobs;
-
Cost: the printed document total cost calculated from the Real cost defined in each queue configuration.
In the lists, (Groups, Queues and Users), several areas are clickable:
-
the name of the queues group or of the queue, which gives access to the history of the printed documents of the group or of the queue;
-
the user name which gives access to the detailed history of his print-jobs.
In the charts, some clickable labels give access to the Reports by interface section where you wille find a detailled report of the activity by Users, roles, printing-devices, analytical codes, applications and workstations. 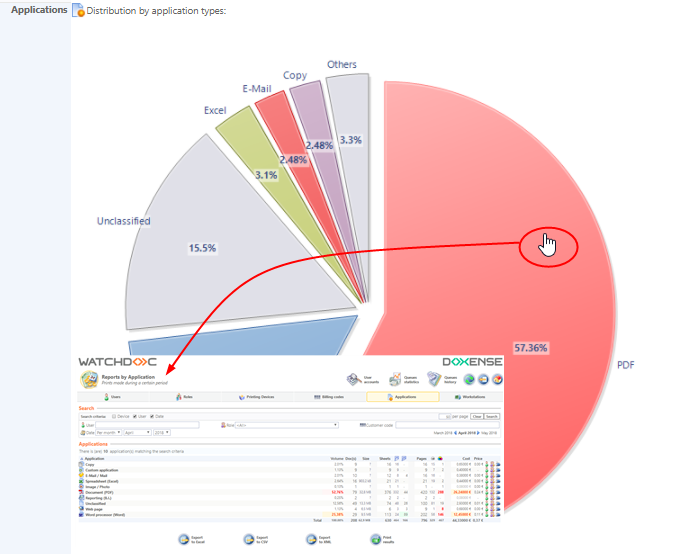
Typology section
Properties sub-section
This section displays the printing activity in the form of graphs according to different criteria :
-
Colour / Black and White
-
Formats (A4 and others)
-
Simplex / Duplex
-
Analysis of the duplex option.
Page Distribution sub-section
This section displays the print-outs based on the number of pages in the print job and it also provides a percentage on the volume represented by each range of documents as well as information about the disk space used.
Averages sub-section
This section displays different averages about proceeded print-jobs: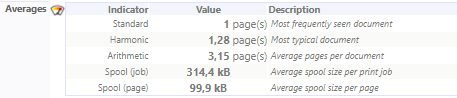
Applications sub-section
This section displays the print-jobs by applications types. The graph is clickable and gives access to the list of prints according to the office applications from which they are derived. This report is also available from the Applications tab.
Status code sub-section
This section displays charts showing the print-jobs according to their status:
-
printed: documents effectively printed;
-
deleted: documents deleted;
-
emailed: documents scanned from the device and sent to an e-mail address;
-
expired: documents not-released by the user within a specified time.