Watchdoc - Activate the Debug mode
Principle
Watchdoc's web administration interface can be displayed in debug mode to make it easier to read the code and analyse it for bugs.
Prerequisite
To activate "debug mode" on the Watchdoc web interface, you must have authorised this mode when installing Watchdoc: in the installation wizard, the Keep diagnostic pages box must be ticked (see Installing the kernel and the website). If Watchdoc was installed without this option, you should update Watchdoc and tick this box.
Procedure
To activate Debug mode :
-
access the Watchdoc administration interface as an administrator;
-
navigate the various administration menus as required;
-
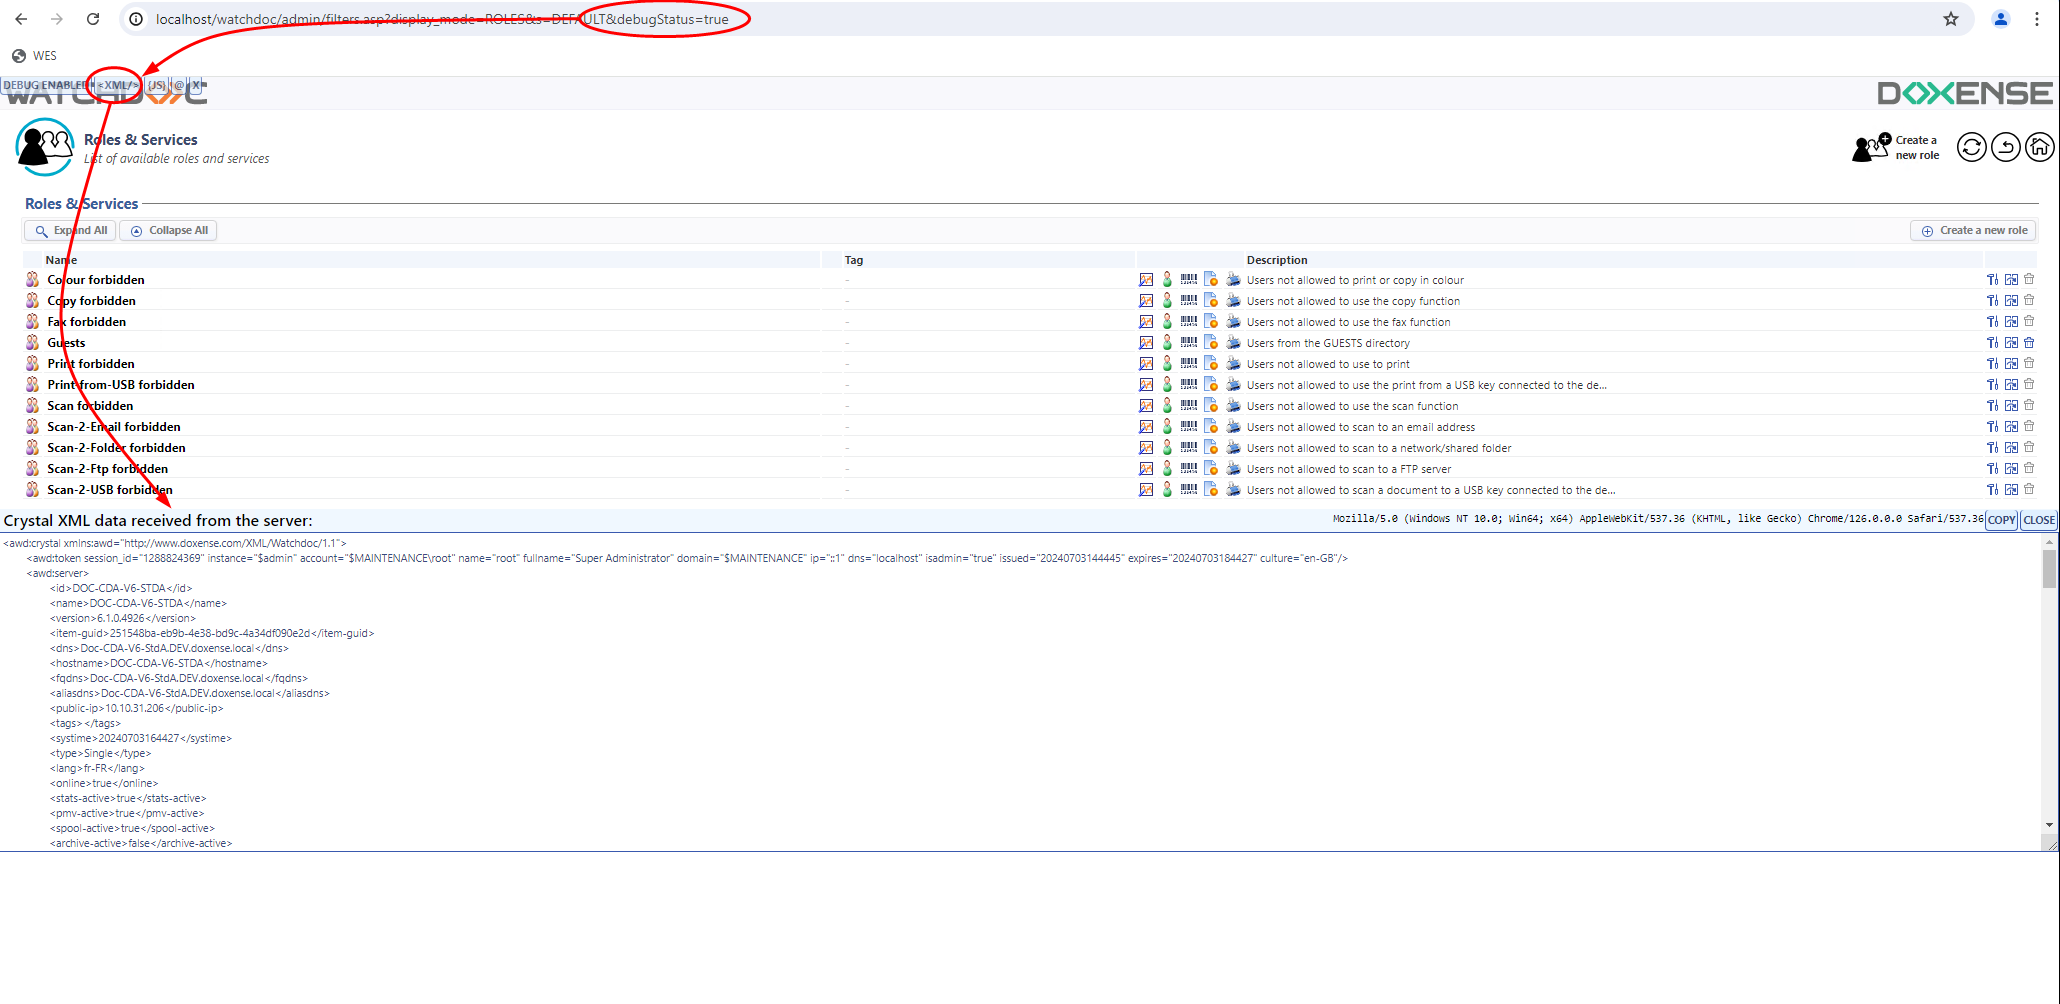
on the page to be debugged, enter the value &debugStatus=true after the url that is displayed;
è Debug Enabled will appear at the top left of the interface, along with the following buttons:
-
XML: provides access to the content of the page in XML format
-
JS: accesses the content of the page in Java Script format
-
@: starts the web page generator installed on the server.
-
-
go to the advanced configuration page (Main menu> Configuration section, Advanced configuration) ;
-
click on the Server Diagnostic button:
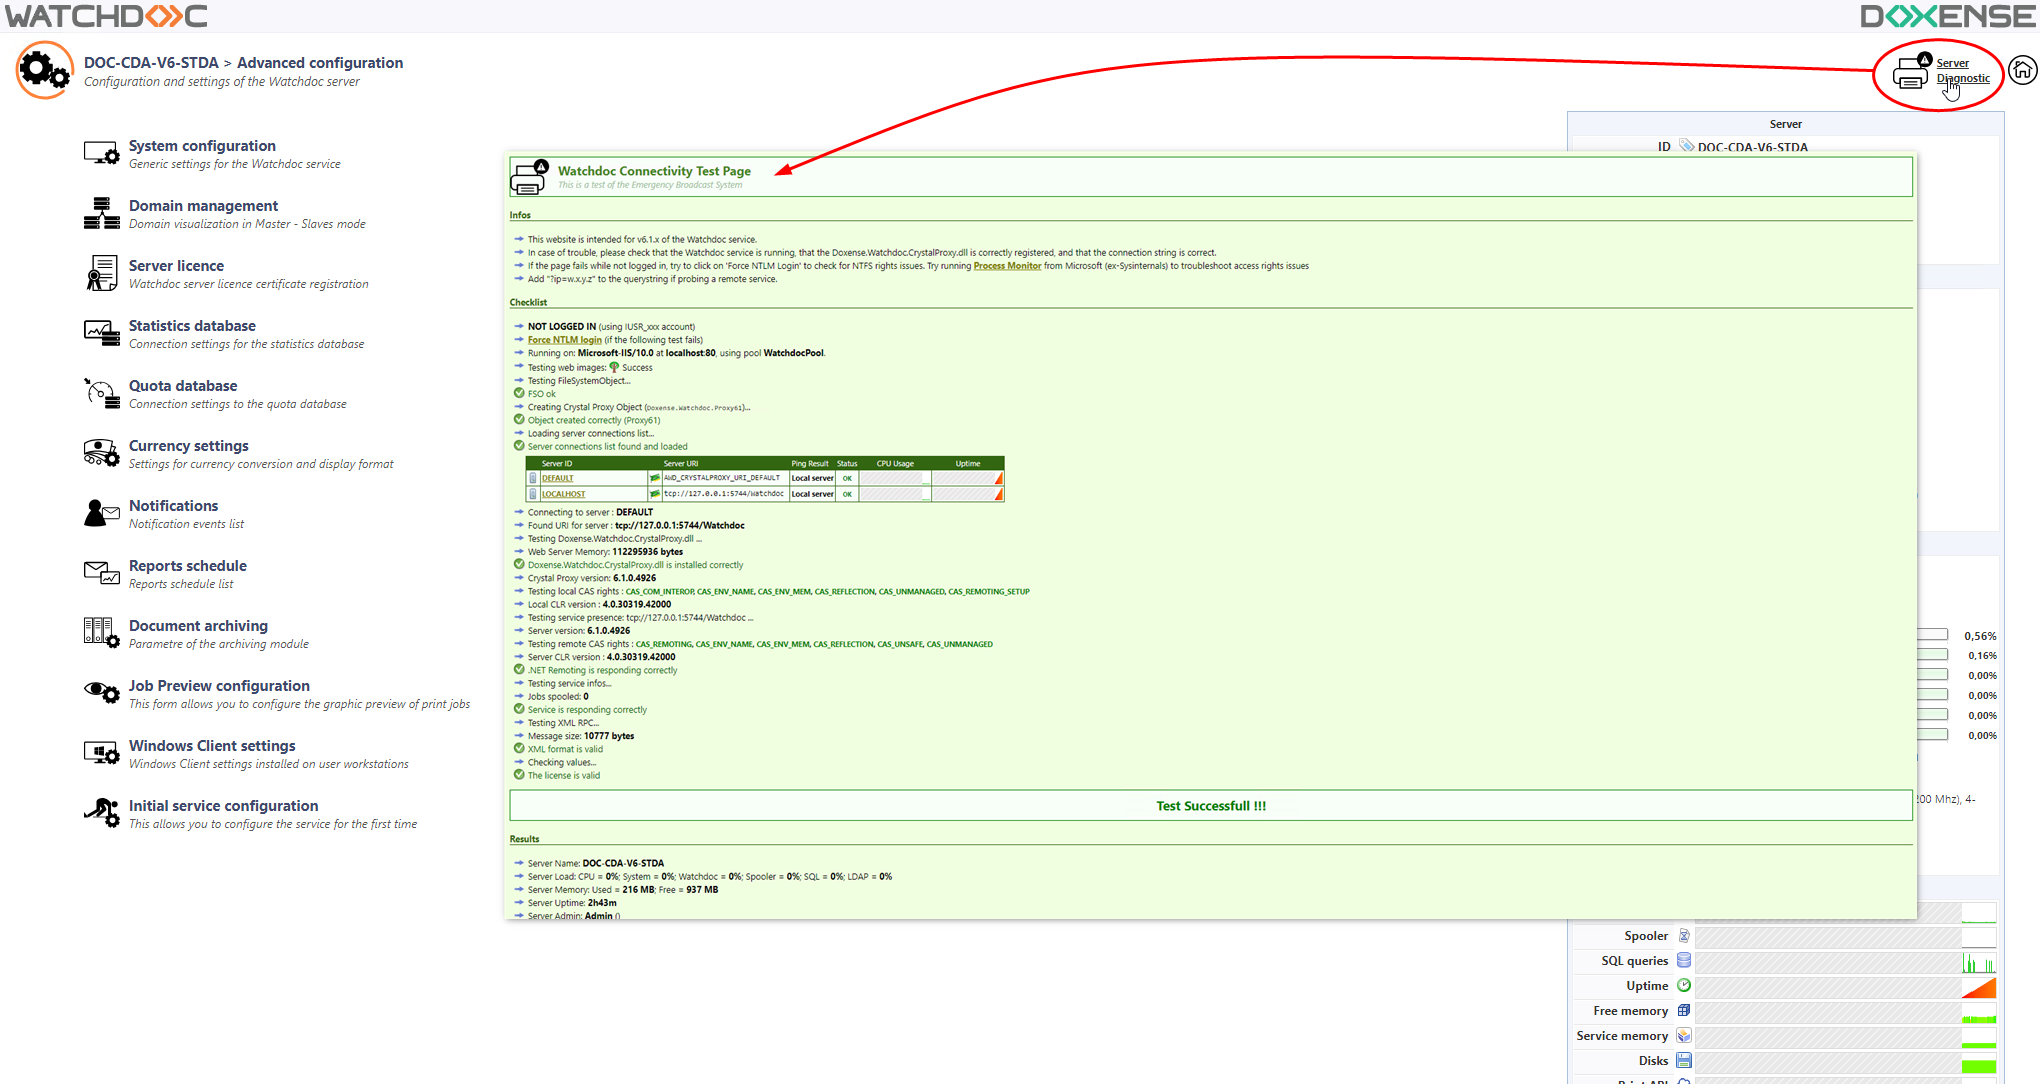
è This will take you to a page diagnosing the tool on the server. This page can be used for analysis purposes.