Dashboard
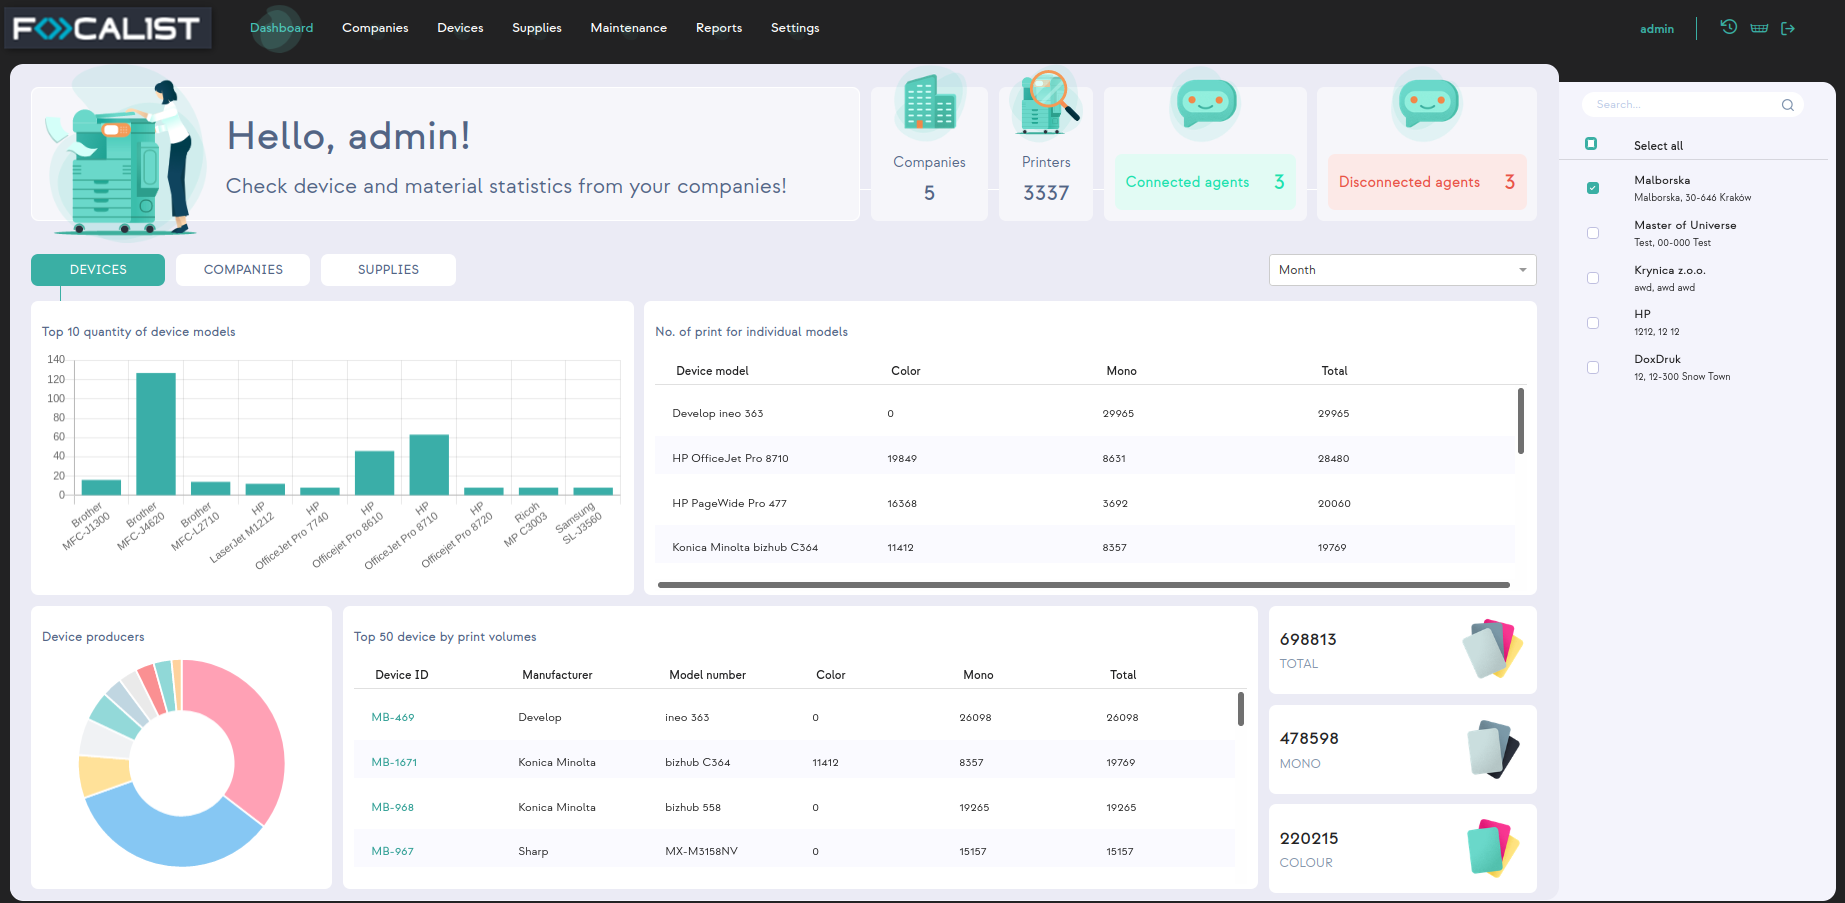
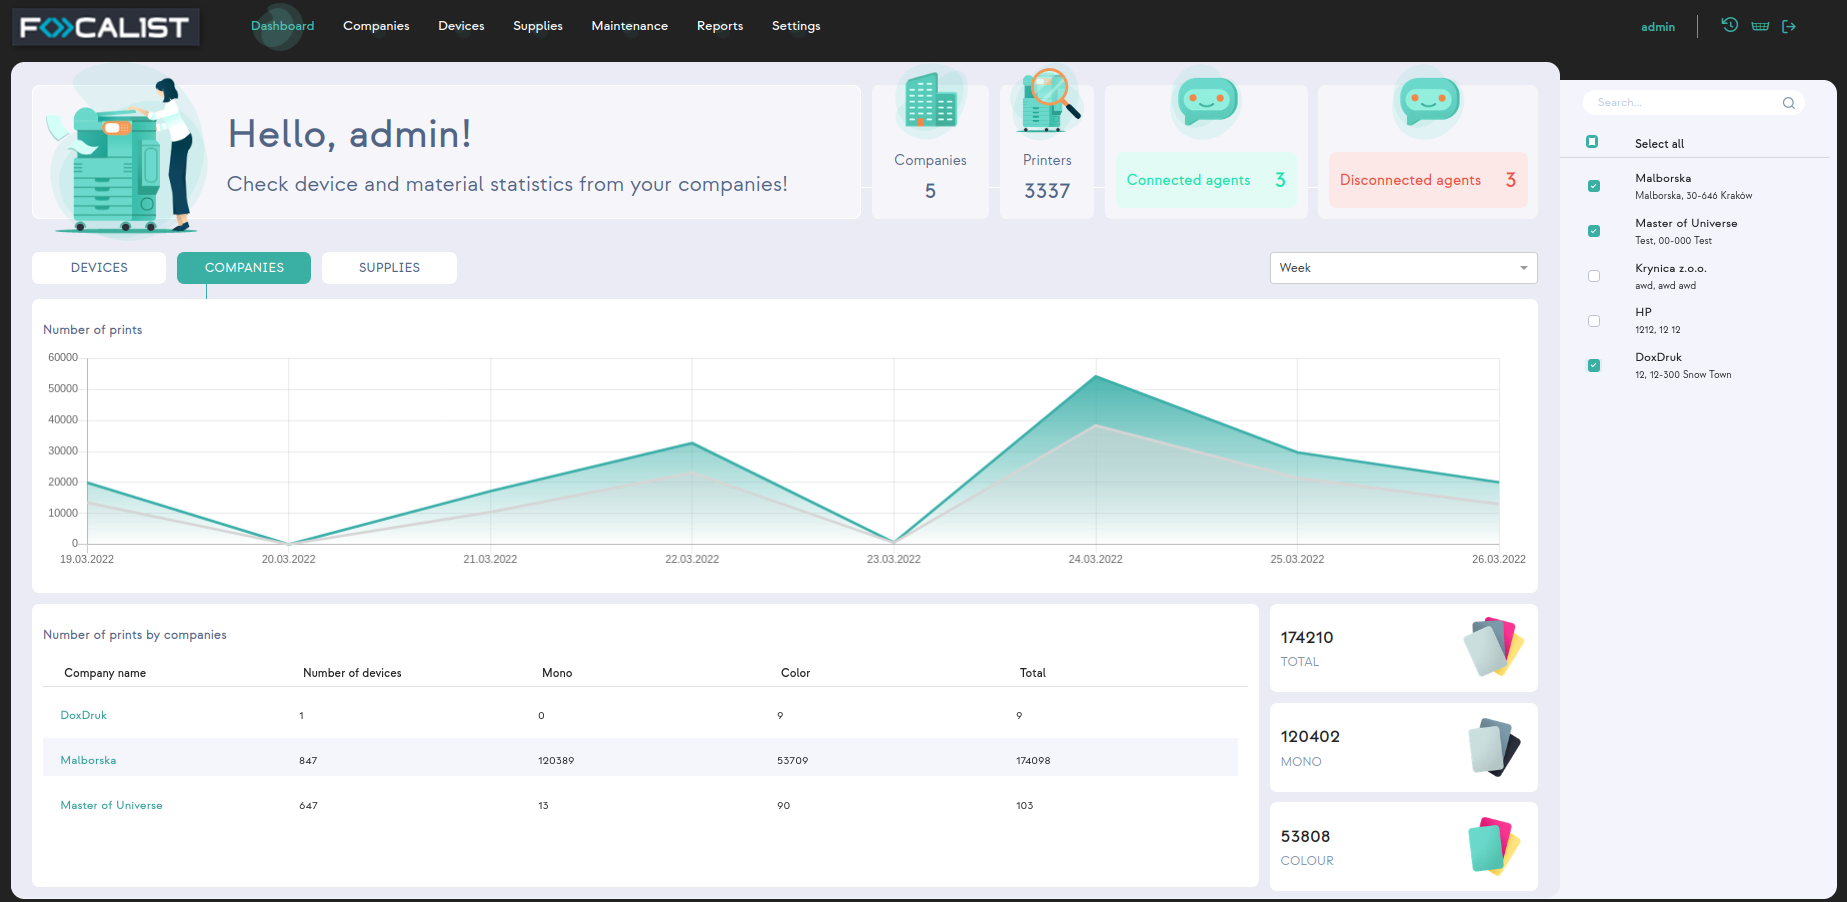
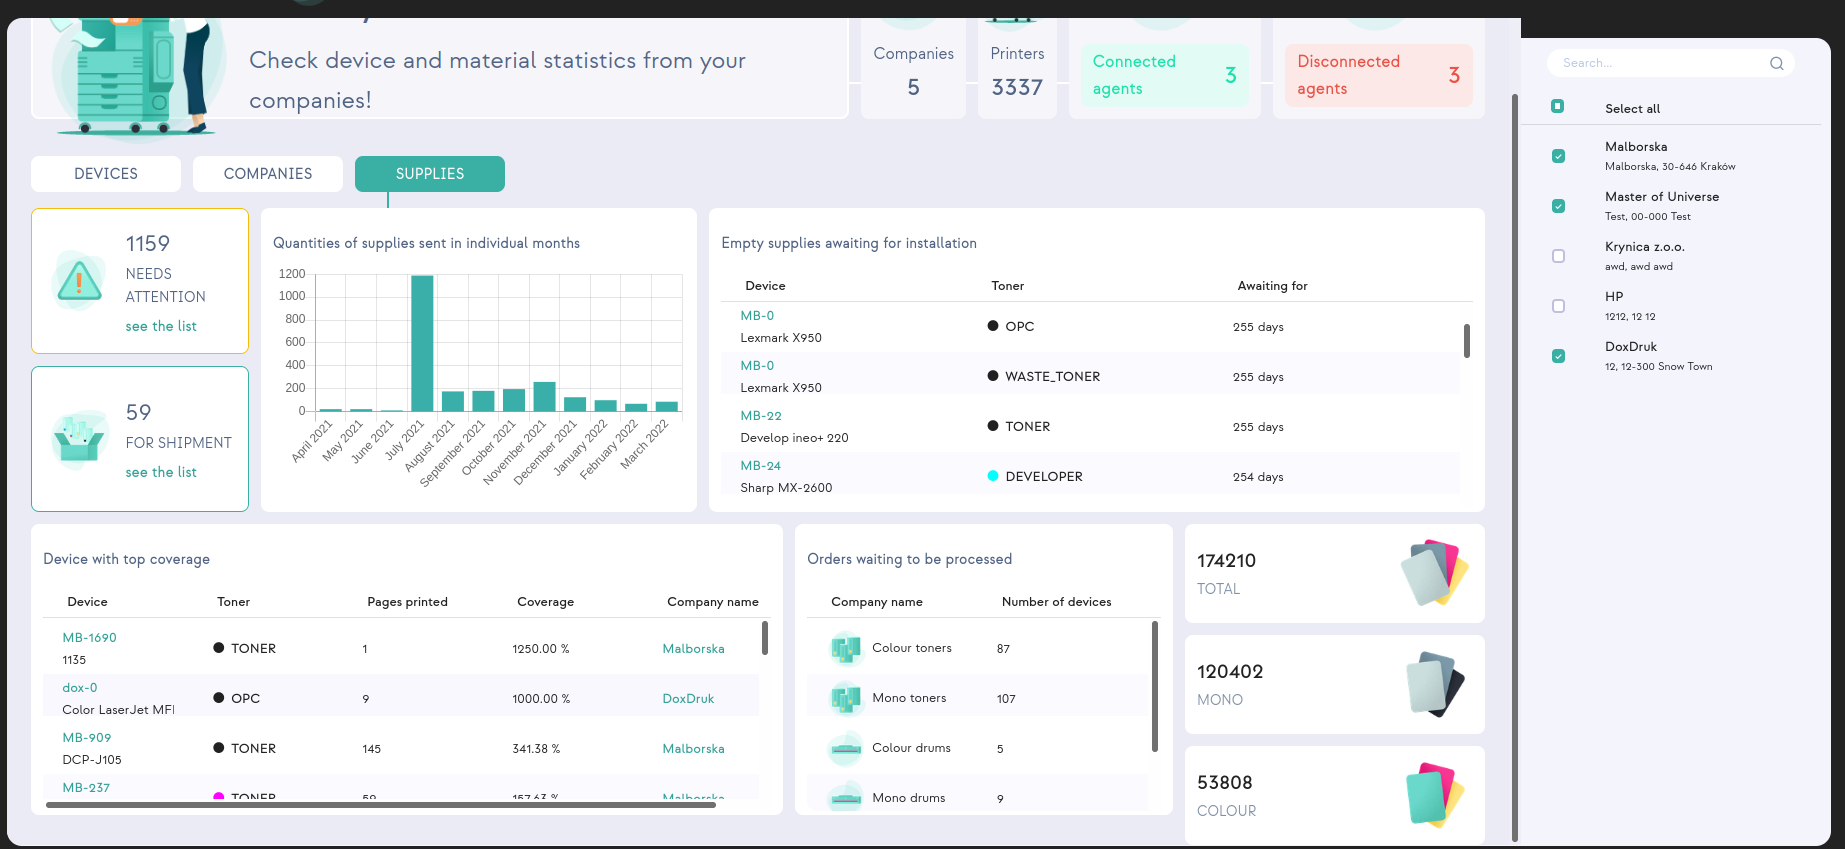
The dashboard contains some statistical information. By default it will load data from one company, the first one on the list. However, you can load more or change companies in the right menu.
The first line at the top of the Dashboard view contains information about the entire application, that is the total number of: companies, printers, connected agent and disconnected one. On the other hand, in the part below there is statistics informationes only for chosen Companies (by default only one). This informationes separate into three different parts:
Devices
This is the basic look that is seen on entering this tab, the one that is on the screen above. You can see here some statistics for your top devices used in chosen companies.
Companies

In the Companies section there is a chart showing the number of pages printed in a selected time interval. In the chart, the total number of printed pages is marked in colorful lines, while Mono is shown in gray lines.
Supplies
This preview contains all information from tab Supplies. Thanks to the menu on the right site all of that data can be easily sorted by the chosen company. This allows to display in a transparent form information, enabling a quick preview of the emerging shortages of resources.
