Epson WES - Troubleshoot the WES
General troubleshooting rules
-
What? What procedure can be used to reproduce the incident?
-
When? What date and time did the incident occur?
-
Where? On which printer did the incident occur?
-
Who? On which user account did the incident occur?
-
Watchdoc.log: thank you for providing the Watchdoc.log file;a
-
config.xml file: thank you for providing the Watchdoc.log file;
-
server/device communication logs: please activate the trace files on each file.
Once this information has been gathered, you can send a resolution request from the Connect portal, the incident management tool dedicated to partners.
To obtain the best possible record of the data required for diagnosis, use the Watchdoc DiagTool® supplied with the Watchdoc installation program (cf. Creating a log report with DiagTool).
Scan, fax and photocopying are not in Watchdoc
If the scan, fax and photocopy jobs are not counted by Watchdoc, verify that the address (host name or IP) of the Watchdoc server configured in the device is correct:
-
Iin the configuration interface of the queue, in the WES section, click on the button Application status (displayed when the WES is properly installed);
-
Click the Download button to download the log files and WES configuration;
-
In the downloaded .zip file, open the Config.json file using a text editor and check the information corresponding to the address of the server (Address) and ports;
-
If the configuration of the address and / or ports is not correct, click on the Configure button on the queue configuration interface.
-
Verify that the procedure has resolved the problem.
Activating WES Traces
To diagnose a problem with WES applications, you need to activate the log files specific to WES communications :
-
in the Watchdoc web administration interface, from the Main Menu, Production section, click Printing queues, queues groups & pools;
-
In the list of queues, click on the name of the queue with the WES for which you want to activate the trace files;
-
in the queue management interface, click on Properties;
-
in the WES section, click on the Edit the settings button:
-
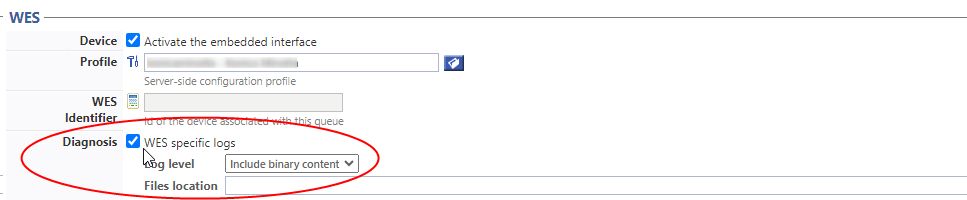
in the WES>Diagnostics section, tick the Enable traces box;
-
in the Trace level list, select:
-
Auto: retains standard traces;
-
Include binary content: retains detailed traces.
-
-
In the Path field, enter the path of the folder in which the trace files should be saved. If you leave the field blank, the trace files will be saved by default in the Watchdoc_install_dir/Logs/Wes_Traces/QueueId installation folder:
WES can no longer find the output queue – Error message: “Unable to locate the output queue” - sept. 2026
Context
A print queue using the cross-server printing function is migrated from one server to another. After initiating a print job to this queue, the user attempting to unblock it is presented with the following error message: “Unable to locate the output queue” (see Troubleshooting WES). In the WES logs, the administrator finds the following message: “! WARN [...] WES|RestApi21Controller “Could not find target ‘Queue [Queue ID]’ in the local config. Any local job will be visible, but will not be able to print on that remote device!”.
Cause
The cache retains the identifier of the queue that has been migrated to a new server. Therefore, if the queue is accessed too soon after its migration, its identifier – which is associated with the old server – is still present in the cache, which has not had time to be cleared.
Resolution
You should restart the Watchdoc service to clear the cache. Then try printing again to check whether this has resolved the problem.